Sensu is an extremely powerful standalone monitoring framework, but the real beauty of Sensu lies in its ability to harmoniously interact with, support, and instrument other tools to create a customized and complete monitoring solution. Take metrics for example: Sensu offers multiple mechanisms to monitor performance metrics such as check output metric extraction and StatsD. On its own, that’s pretty cool, but combined with Sensu’s robust event pipeline, you can cater different methods of metric analysis to your specific needs. Application performance monitoring? Yas. System metrics and telemetry data? Oh yeah. Metric aggregation? We gotchu.
 Raise the roof, 'cause your monitoring is all under one roof.
Sensu supports four different metric formats for check output metric extraction, and can integrate with any time series database as long as there’s a handler written for it. In this post, I’m going to walk you through just one of the endless permutations of metrics software you can pair with Sensu:
- Collect using Sensu check output metric extraction
- Transform with a Sensu InfluxDB Handler
- Record in an InfluxDB time series database
- Visualize on a Grafana dashboard
This blog post assumes you have Sensu 2.0 installed. If you don’t, first of all why not? StatsD and check output metric extraction are new features to 2.0! For instructions on setting up Sensu 2.0 so you can do all the new and shiny metrics things, please see our Installation and Configuration guide.
Note: This guide will take you step by step to configure Sensu, InfluxDB, and Grafana for check output metric extraction. If you’d rather spin up pre-configured instances, Sensu Test Day has self-contained Docker containers that are pre-baked for this use case. Choose your own adventure!
Collecting metrics
To collect metrics using Sensu check output metric extraction, you’ll first need to spin up a backend, agent, and cli.
Backend:
sensu-backend start
Agent:
sensu-agent start --subscriptions metrics
CLI (see Configuring sensuctl):
sensuctl configure
Once you have Sensu running on your selected host(s), you’ll want to create a check and configure it to extract metrics. The script we’re using for collection (metrics-graphite.sh) prints out several metrics in Graphite Plaintext Format. Sensu supports several other metric formats for extraction, so feel free to customize your check accordingly, or try out other example formats.
Note: The example metric extraction scripts provided are only compatible with OSX. If your agents are running on any other operating system (Sensu supports just about all of them), you’ll have to tweak your scripts for compatibility. As long as the check command prints out at least one metric in the specified output-metric-format, you should be good!
sensuctl check create collect-metrics --command metrics-graphite.sh
--interval 1 --subscriptions metrics --output-metric-format
graphite_plaintext
After the check has executed (this shouldn’t take too long), validate that your metrics have been collected, extracted, and stored within the check’s event.
sensuctl event info [entity-name] collect-metrics --format json
Transforming metrics
Now that we have Sensu events from our checks and metrics, we need to handle them. Sensu-influxdb-handler, a little tool I wrote, will transform any metrics contained in a Sensu event and send them off to a configured InfluxDB. Make sure you download the newest handler from releases.
sensuctl handler create sensu-influxdb-handler --command
"sensu-influxdb-handler --addr http://localhost:8086 --username [username]
--password [password] --db-name [db-name]" --type pipe
Assign the handler we just created to the check from the first step.
sensuctl check set-output-metric-handlers collect-metrics
sensu-influxdb-handler
Record metrics
You’ll also need the InfluxDB daemon running on the configured address for the database and credentials you’ve provided to your handler command above.
influxd
You can verify that the metrics have been handled and recorded by querying your InfluxDB.
Visualize the metrics
Now that the data is in a time series database, let’s hook it up to a dashboard. Start a Grafana server (ensure there are no port collisions with Sensu in the Grafana config file) and customize your dashboard based on the check’s outputted metrics. Depending on how you installed Grafana, start the server by the recommended method.
brew services start grafana
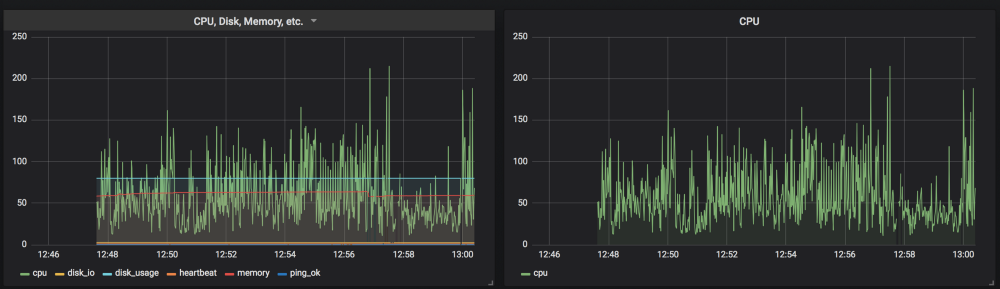
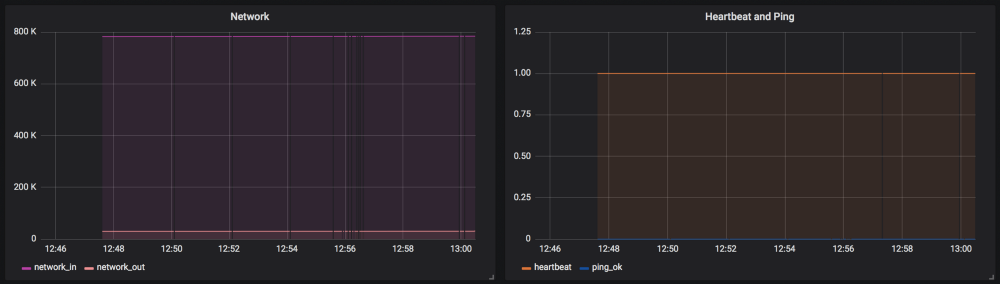
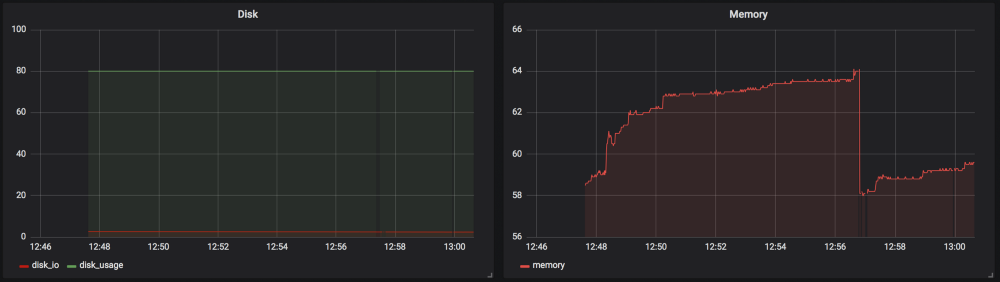
You can utilize this dashboard configuration, ensuring you replace [ENTITY NAME] with the host name of the monitored entity. You’ll also need to connect your Grafana dashboard to the InfluxDB datasource named “Sensu Metrics.” If you’re unsure of how to do that, check out this guide. If all goes well, you should be able to see your real-time metrics being collected by Sensu checks, like in the below dashboard!
Closing thoughts
Pretty cool, right? Sensu 2.0 is not only improving infrastructure monitoring, but it’s also expanding on application performance monitoring, too! If you haven’t already, we encourage you to give 2.0 a try and send us your feedback. We can’t wait to hear what you think!

Made with #monitoringlove by SensuTM in Canada 🇨🇦 and the USA 🇺🇸. © 2017-2021 – Privacy Statement – Terms & Conditions