This post was adapted from an article originally published in The New Stack, with contributions from: Caleb Hailey (CEO, Sensu), Seng Phung-Lu (AVP Site Reliability Engineering, TD Bank), Sean Simon (Sr. IT Architect, TD Bank), David Beaurpere (Principal Software Engineer, Workday).
“Everything as code” has become the status quo among leading organizations adopting DevOps and SRE practices, and yet, monitoring and observability have lagged behind the advancements made in application and infrastructure delivery. The term “monitoring as code” isn’t new by any means, but incorporating monitoring automation as part of an infrastructure as code (IaC) initiative is not the same as a complete end-to-end solution for monitoring as code. Monitoring as code is not just automated installation and configuration of agents, plugins, and exporters – it encompasses the entire observability lifecycle, including automated diagnosis, alerting & incident management, and even automated remediation.
Continuous Integration and Continuous Delivery (CI/CD) drastically changed the way we build and deploy applications. With the advent of DevOps, infrastructure as code, and containerization, infrastructure and IT management have become decentralized. Now, organizations can be more agile, shipping high-quality software more quickly. CI/CD, configuration management, infrastructure as code, and cloud computing all came out as tooling to facilitate that high-velocity change, but — until recently — monitoring tools were still reacting to the changes in the modern IT environment.
A comprehensive CI/CD initiative should include monitoring and observability. In this post, I’ll examine how monitoring as code fills that gap.
But first, a brief history of CI/CD.
CI/CD and IaC: a brief history
The IT operations world has seen a LOT of change over the last 10-15 years. Although it’s now quite common to find a CI/CD pipeline in an organization, it’s a relatively new concept. In the beginning there was Continuous Integration[1], and CI was only thought of as a development tool for testing and building applications, not automating other operational concerns.
Everything changed around the time of John Allspaw’s 2009 talk, “10+ deploys per day”[2], and Jez Humble and David Farley’s 2010 book, Continuous Delivery. We realized we could do a lot more with CI than just build and test application code – we could also automate parts of the release and deploy process… and thus, the CI/CD pipeline was born.
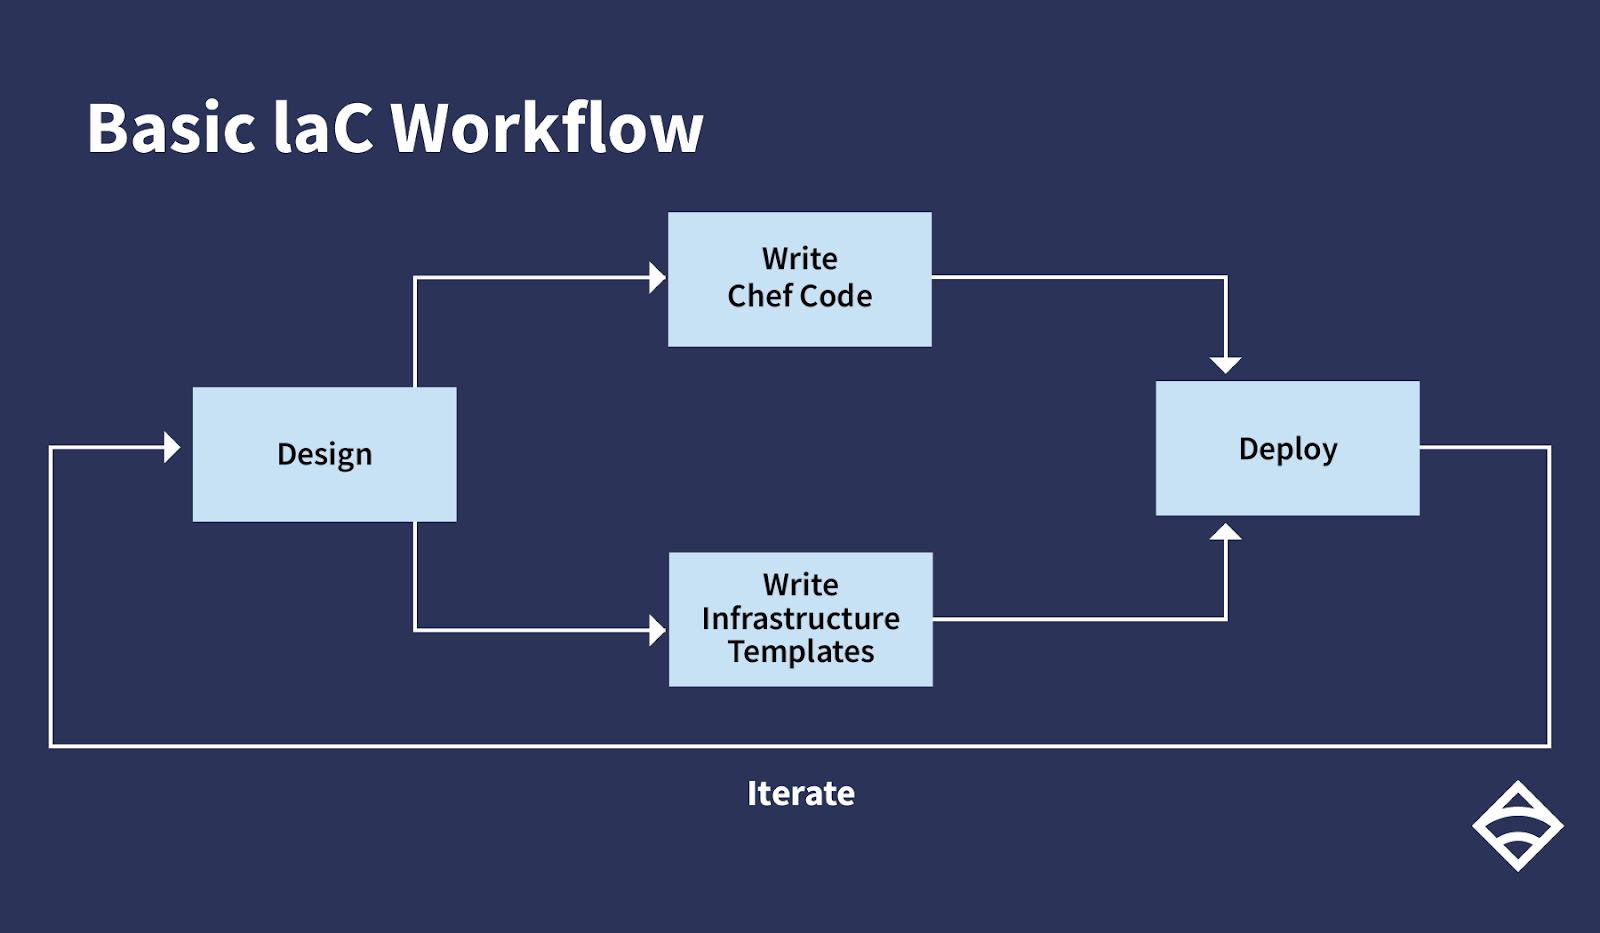
Before we knew it[3], the term “infrastructure as code” entered the vernacular and became a major foundational element of the DevOps movement, allowing developers and operators to increase velocity while improving repeatability, reliability, and maintainability. By codifying your infrastructure and application deployment in the same way, you establish one framework — one source of truth — for the state of configuration for everything from your infrastructure to your applications. Managing infrastructure as code meant we could integrate infrastructure into this new CI/CD pipeline.
The new new infrastructure as code, and where observability fits in
Fast forward to today: CI/CD and IaC continue to evolve, and containerization and container orchestration through platforms like Kubernetes are the new normal. The first generation of infrastructure as code was more literal in that we were spending a lot of time writing “code” using complex DSLs or actual programming languages like Ruby. With Kubernetes, we have a common packaging solution (containers) and are able to describe more of the underlying infrastructure[4] as declarative YAML “code”. This has reduced the barrier of entry and made IaC more attainable for many organizations. Now you can automate application deployment within minutes instead of months.
The overwhelming success of CI/CD has created an insatiable demand for “everything as code” solutions. Although there’s still more work to be done, tools and platforms like containers and Kubernetes have continued to mature and bring infrastructure as code principles to the masses. But where does that leave monitoring and observability?
Integrate observability into the CI/CD pipeline with monitoring as code
The most advanced organizations have already reached a conclusion that we think the rest of the industry will arrive at over the next decade of CI/CD: it’s imperative to incorporate more ongoing operational functions into our delivery pipelines, with monitoring and observability primary among them.
Anyone building and deploying applications in the modern era needs to incorporate monitoring the same way they’re defining and deploying infrastructure: as code, via a centralized pipeline. This becomes even more critical to operational safety as the number of software components increases (e.g., microservices) or the number of organizational units increases.
Incorporating the active monitoring of the infrastructure under management results in a symbiotic relationship in which new metrics and failures are collected and detected automatically in response to code changes and new deployments. Monitoring as code is the key to this unified view of the world and management of the entire application lifecycle.
Infrastructure as code for monitoring is NOT the same as monitoring as code
When we search the web for “monitoring as code,” we find a number of blog posts from a variety of popular monitoring tools. But as we dig deeper, what they are describing is not monitoring as code, but rather simply deploying an agent or configuring an exporter with configuration management tools like Puppet, Chef, Ansible, Terraform, or Helm — AKA, infrastructure as code for deploying monitoring. These solutions don’t offer ways to configure much of the monitoring solution beyond simple data collection. This is largely a result of trying to retrofit traditional monitoring tools and workflows into the modern DevOps paradigm.
“Most of the existing options for monitoring as code are limited to data collection configuration; they lack the ability to codify the reactive logic and automation that you get from tools like Sensu.” — Principal Software Engineer @ Fortune 1000 fintech organization
Check out this 8-minute explainer video on monitoring as code with Sensu Go:
With this approach, developers are building, testing, and deploying their applications and monitoring data collection via the unified CI/CD pipeline, and then managing the rest of the monitoring solution completely out-of-band of this pipeline (e.g., configuring alerting rules and integrations by clicking buttons in a SaaS-based monitoring dashboard). Comprehensive monitoring as code includes collection, diagnosis, alerting, processing, and remediation (self-healing), all defined as code.
End-to-end monitoring as code should include:
- Instrumentation. Installation and configuration of plugins and exporters.
- Scheduling & orchestration. Management of monitoring jobs (e.g. collect, scrape).
- Diagnosis. Collection of additional context (e.g. automated triage, including validating configuration, examining log files, etc).
- Detection. Codified evaluation, filtering, deduplication, and correlation of observability events.
- Notification. Codified workflows for alerts and incident management, including automatically creating and resolving incidents.
- Processing. Routing of metrics and events to data platforms like Elasticsearch, Splunk, InfluxDB, and TimescaleDB for storage and analysis.
- Automation. Codifying remediation actions, including integrations with runbook automation platforms like Ansible Tower, Rundeck, and Saltstack.
One of the primary benefits of the “everything as code” movement is version control, which provides logical “checkpoints” representing the state of our systems at a given point in time. If the complete monitoring and observability solution is not managed in the same manner as the systems they monitor (as code, via a centralized CI/CD pipeline), it becomes decoupled in a way that makes it difficult or impossible to reason about over time. By adopting true monitoring as code, you get version control of monitoring aligned with the building, testing, and deployment of your product and services, improving visibility, reliability, and repeatability.
"Monitoring as code solves a bane for many projects whereby unexpected issues during pre-production testing or deployments go undetected. We lose hours allowing failing tests to continue, then more time troubleshooting the problem, and of course, we miss the opportunity to investigate root cause at the point of failure. With monitoring deployed alongside the application via a single, unified pipeline, we catch any issues early and avoid having to manually babysit the testing and CI/CD process.” – Seng Phung-Lu, AVP Site Reliability Engineering, DevOps Tools Engineering, and Cloud Monitoring at TD Bank
With Sensu, for example, you have the ability to define your entire end-to-end monitoring solution including collection, diagnosis, alerting, processing, and remediation (self-healing) as declarative JSON or YAML code. When a new endpoint spins up (such as a cloud compute instance or Kubernetes Pod), Sensu automatically registers itself with the platform and starts collecting monitoring and observability data; the automated diagnosis, management of alerts, and remediation of services are all defined as code. With a complete monitoring as code implementation you can blow away your existing deployments and bring them back in a repeatable and reliable manner; this also provides additional benefits in pre-production environments as Seng commented on above.
If you’re already investing in CI/CD and IaC, you already have pipelines for versioning, building, testing, and deploying your software. It only makes sense that you would have your monitoring go through the same lifecycle — it’s all part of the same workflow. It’s all integrated.
Looking ahead
As code workflows are the norm, and the next logical step in the progression following Continuous Integration, Continuous Deployment, and infrastructure as code is monitoring as code – automated monitoring of our systems, as code, coupled to the applications and infrastructure under management.
Over the last 10+ years, CI/CD became the foundation for how we build, test, and deploy our infrastructure and applications. Over the next 10 years, we’ll see the rest of the application lifecycle (including monitoring and observability) managed as code and integrated into this same pipeline. In that near future, you’ll have true point-in-time context for complete visibility into your critical infrastructure, with version control that aligns with the building, testing, and deploying of your applications.
Watch our webinar: Practical monitoring as code
Sign up to receive the recording of our on-demand webinar when it becomes available on February 25, 2021. You’ll learn:
- What monitoring as code means, and why it matters.
- How to get started with your own monitoring as code workflows.
- How the SensuFlow GitHub Action works.
- How to apply monitoring as code to your own CI/CD pipeline.

A term first proposed by Grady Booch in his 1991 publication, Object Oriented Design: With Applications ↩︎
“10+ deploys per day”. Fun fact: Patrick Debois was inspired so much by this “10+ Deploys per Day” talk that he was motivated to launch the inaugural “DevOpsDays” conference in Ghent, Belgium in the fall of 2009. ↩︎
Thanks to the growing popularity of configuration management tools (Puppet launched in 2005 and Chef in 2009), the terms “DevOps” and “infrastructure as code” (IaC) entered our vocabulary. ↩︎
Including compute, storage, and even networking (thanks to the advent of the service mesh). ↩︎


