Or, why we spent $10K on gaming hardware to improve our product
This time last year, Sensu Go hadn’t been released in General Availability (GA) yet. Now, 10 months later, version 5.14 is in production environments, monitoring infrastructure, applications, and connected devices across public and private clouds. It’s been quite a journey to get to a product that’s both a massive improvement over the original Sensu 1.x and helps customers achieve enterprise-level scale.
In this post, I’ll review my Sensu Summit 2019 talk on how we scaled Sensu Go — gaining 10x improvement in performance in six months — with some tips on how you can too.
The goals and origins of Sensu Go
When we set out to create Sensu Go, we had two primary objectives:
- Ease of use: We wanted customers to achieve quick time to value, so Sensu Go had to be easy to get started and deploy, with a seamless onboarding experience for additional teams within your organization.
- Natural scaling path: We also wanted Sensu Go to be easy to get on a laptop, a VM, a host, in the cloud or on prem — with natural steps to scale its architecture.
We were thinking in terms of both performance scalability (e.g., how many things you can manage, monitor and observe — and how to process all that data in a timely fashion) as well as organizational scalability (e.g., how to spread Sensu organically through your organization for shared value). For the purposes here, I’m focusing on the performance aspect.
Taking a step back, I want to acknowledge that although Sensu 1.x had quite a steep learning curve, it could scale to pretty impressive levels. For instance, in this Sensu Summit 2017 talk, Michael McLane and Thomas Duran from GoDaddy explained how they monitored over 40,000 devices with more than 100 Sensu deployments. To achieve these numbers, they essentially built a lot of infrastructure to monitor their infrastructure, and then added monitors to, well, monitor their monitors. Its scale was impressive, with built-in automation to keep it manageable. However, it was still a lot of infrastructure.
When early adopters of Sensu Go attempted to run at scale, the simple truth is that the wheels fell off. We realized we needed to hit pause and make some much-needed improvements.
How we improved Sensu Go’s performance by 10x in 6 months
INSTRUMENTATION
To start, we instrumented our backend application and the agent so we could observe runtime behaviors and see how certain features interacted with one another. Essentially, we needed to bake visibility into the visibility tool to get a reliable view of performance.
AWS TESTING ENVIRONMENT
Next, we stood up a test environment on AWS, everything from an M5.2xlarge to i3.metals (yep, that was about as fun as you’d expect), and we developed an agent session load tool that could reasonably produce over 40,000 active agent sessions. In short, we aimed to create realistic operating agent sessions in a single process so we could scale to extremes.
The early results were pretty disappointing — we could only get around 5,000 connected agents and 5,000 events per second. Plus, the results were inconsistent. We’d run a performance test and things would break, and we weren’t confident whether it was our software at fault or the variability of our testing environment.
GET SERIOUS (AKA SPEND $10K IN GAMING HARDWARE)
If we wanted to get serious about making improvements, we would need to make a further investment. Which naturally meant spending $10K on gaming hardware:
If you’re wondering why we’d buy a whole bunch of bare metal in 2019, let alone why gaming hardware, it really came down to:
- Control
- Consistency
- Capacity
Sure, you can get capacity at the click of a button or an API request. But our setup meant guaranteed consistent capacity — a very strict environment, with few variables, stripped down to bare hosts running Fedora 30. There was no virtualization, network hops were very short, and so were the cables. If there was a problem with a device, or one differed from the others, we could replace it.
We built it out with three backend nodes running embedded etcd, with a single large box for the agent session load tool:
BACKEND HARDWARE
For the backend hardware, we chose to use AMD Threadrippers (the fact that Sensu Engineer Justin Kolberg is known online as @AMDprophet may have factored into that decision), with a high number and density of CPU cores, and a decent enough platform that would represent a generic VM on a modern cloud. We used two commodity SSDs, one for the root volume and one dedicated to the etcd data. And then we had a separate network card for Gigabit ethernet for that data backplane.
- AMD Threadripper 2920X (12 cores, 3.5GHz)
- Gigabyte X399 AORUS PRO
- 16GB DDR4 2666MHz CL16 (2x 8GB)
- Two Intel 660p Series M.2 PCIe 512GB SSDs
- Intel Gigabit CT PCIe Network Card
AGENTS HARDWARE
On the agent side, we chose the 32-core AMD Threadripper CPU. (In the video, that’s the gaudy white box with the giant green spinning fans.)
- AMD Threadripper 2990WX (32 cores, 3.0GHz)
- Gigabyte X399 AORUS PRO
- 32GB DDR4 2666MHz CL16 (4x 8GB)
- Intel 660p Series M.2 PCIe 512GB SSD
NETWORK HARDWARE
On the network side, we separated the load tool traffic and the backend etcd communication.
- Two Ubiquiti UniFi 8 Port 60W switches
- Separate load tool and data planes
The verdict? Results weren’t much better than what we had on AWS 😞 Although, hour after hour as we re-ran our tests, results remained consistent. This was progress! By getting more control and reducing variables, we were able to produce a fair bit of data, identify bottlenecks, and even reproduce a number of bugs that only showed themselves under significant load. Our users were experiencing these bugs too, but up until this point, we hadn’t been able to reproduce them ourselves.
EXPERIMENTATION & RESULTS
From there, we introduced a number of changes that continued to provide incremental improvements, including:
1. Disabling event persistence. Over 95% of our etcd write operations were for events, which was essentially abusing etcd because it’s not designed to have such a high rate of churn on write operations. We disabled event persistence, effectively breaking Sensu as a monitoring tool — we still had the pipeline, but we weren’t able to see things like state changes. Removing events from the equation helped us go from around 5,000-6,000 events to 12,000 events per second.
2. Moving event storage to Postgres. At max, the etcd database size is 10GB (ostensibly, it’s actually 8GB, but you can configure it to 10GB), which means you can easily reach the limit of how many devices and events you can monitor. We decided to move the workload to Postgres, which would also open up new functionality around things like longer-term history and report generation. The Postgres hardware was essentially the same as the backend node, with the addition of two more Intel network cards (bonded for ~3Gb/s).
The results weren’t dissimilar to when we removed event persistence, which was good news because it told us Postgres wasn’t limiting us. Something else must have been happening on the backend.
New results with PostgreSQL:
- Agents: 4,000
- Checks: 14 at 5-second intervals
- Events/second: 11,200 (not good enough!)
To double check, we further pruned Postgres. Because Sensu’s event data is constantly churning very rapidly, it’s taxing to Postgres, so we had to do an aggressive amount of auto-vacuuming to clean it up:
- vacuum_cost_delay = 10ms
- vacuum_cost_limit = 1,000
- autovacuum_naptime = 10s
- autovacuum_vacuum_scale_factor = 0.05
- autovacuum_analyze_scale_factor = 0.025
We also configured the write-ahead log to reduce disk operations and to make sure that Postgres wasn’t our bottleneck.
3. Identifying a primary bug. Next, we identified a huge bug that led to the most significant performance upgrade for Sensu Go: adding a single conditional that took us from three etcd operations per event down to one.
We saw very promising results with this bug fix: performance improved by 3X!
- Agents: 4,000
- Checks: 40 at 5-second intervals
- Events/second: 32,000 (Much better! But still not good enough.)
We knew that everything was tied to etcd. If we could do less with etcd, we could do more with Sensu. We were on the right path, but needed to do better.
4. Removing more operations from etcd. We saw that there was a range of read requests for every event, so we ended up caching entities and silencing entries to reduce those range requests by 50%. Unfortunately, this didn’t result in any more throughput, but was a worthwhile exercise in case those requests became a limitation later on.
5. Switching from JSON to Protobuf. We realized that we were spending a great deal of time for CPU simply serializing data for transport to and from the agent (as well as storing data in etcd). Switching from JSON to Protobuf reduced data size by 10x, resulting in less networking bandwidth, and less CPU for encapsulating and serializing the data. Even with the 10GB storage max for etcd, we’d be able to store 10 times as many events.
6. Increasing backend internal queue lengths and worker counts. We had a high number of fixed backend queues and internal workers within the monitoring event pipeline that pulled and processed data, so we increased queue lengths from 100 to 1,000 and increased worker counts from 100 to 1,000 — and made both configurable so they could be tuned to their environment. A cool byproduct of this? Not only do we get configurable concurrency, we can also absorb latency spikes. So whenever Postgres takes a long time completing a sync, we get some internal buffering that smooths out event processing.
Our new results were tremendous: From 4,000 to 36,000 agents, 38 checks at 10-second intervals against 4 subscriptions (which simulates a more realistic scheduler load), and 34,200 events per second. We were almost there!
We felt hopeful we were getting close. Our results were no longer limited by the Sensu backend, which was stable, even under-utilized, so we just had to tackle the strain on Postgres. We added a Samsung 970 PRO 1TB SSD (more commodity hardware!) and found our happy place: just under 40,000 events per second.
To recap the entire journey: we’d instrumented our backend and Postgres; captured all of this data to help us understand what Sensu does under stress and under load; and discovered its capabilities as a technology. Most encouragingly, where it had once been a struggle to get 4,000 events/sec, we were now getting 40,000 events per second, well exceeding any capability of Sensu 1.x.
How you can reproduce our performance tests
The good news is that you can make use of what we’ve done and reproduce it on your own infrastructure using the Sensu performance testing project on Github. We recently applied these tests to a customer who was hitting limits at 4,000 devices, and by the end of day two, we had them close to these 40,000 numbers.
We’ve also rolled these tests into our release QA process to help capture performance regressions and make sure we never ship a release that performs any worse than the version before.
Deployment architectures and hardware recommendations
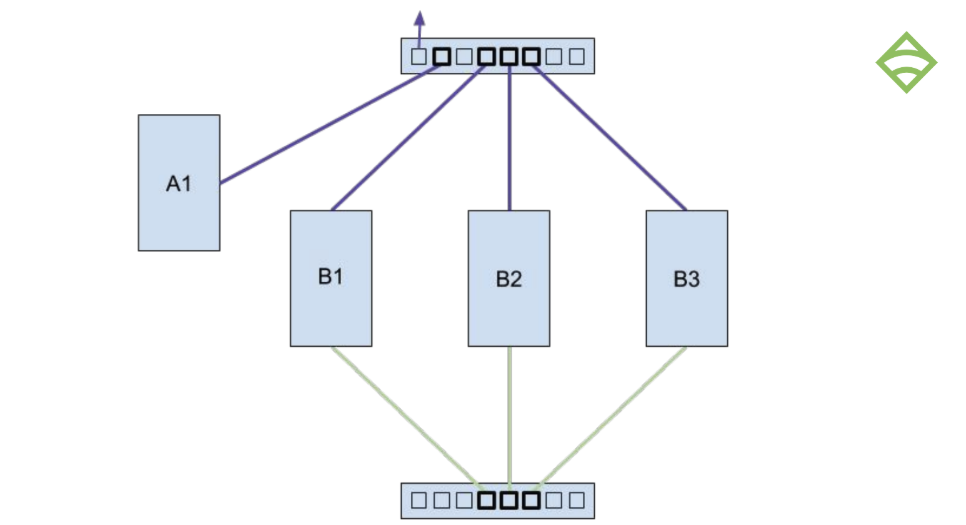
As you’re getting started, keep in mind that you have a lot of flexibility in deployment architectures. Not surprisingly, a simple architecture may be the easiest place to start, e.g., on your laptop or a single VM. You can run three of them with an embedded etcd cluster, similar to the environment on which we ran our performance tests.
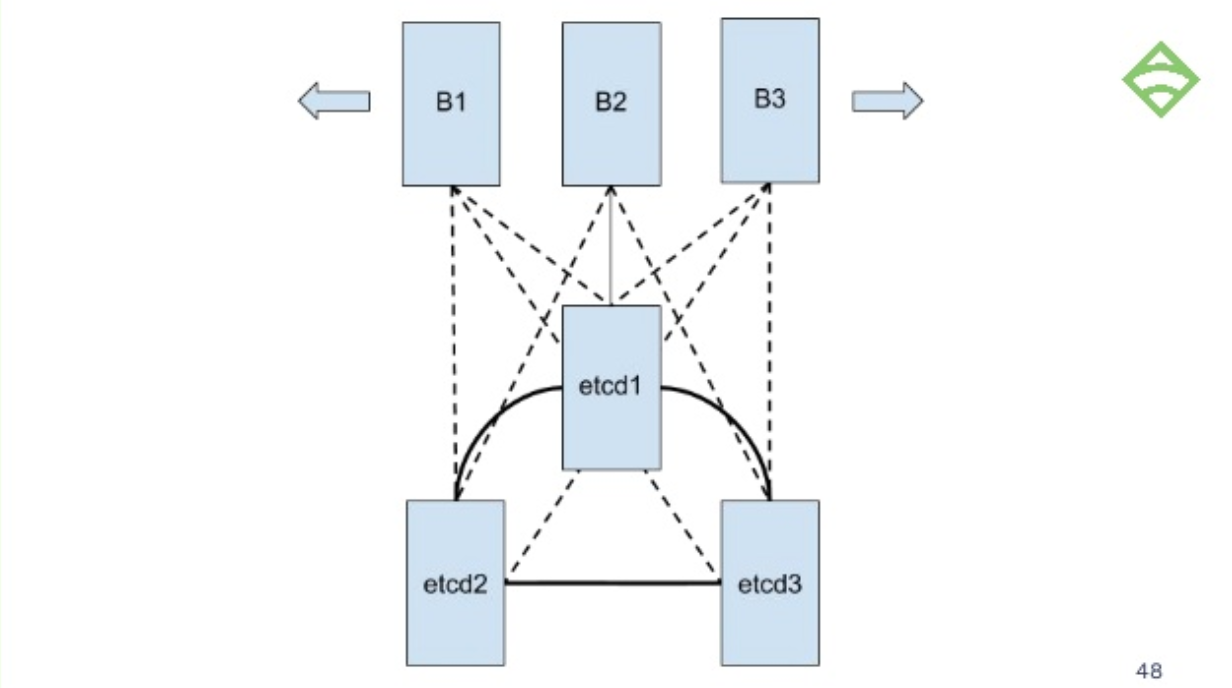
You can, of course, get a lot more complicated by running a separate etcd cluster of three nodes, give it the CPU resources, memory, and fast disks it needs, and then scale your backends out horizontally, which offers great potential for scaling:
If you want to go beyond the capabilities of etcd, you can run Postgres on the side.
Or, you could put a load balancer in front of your backends so you can load balance your dashboard or API requests, or connect your agent connections through the load balancer:
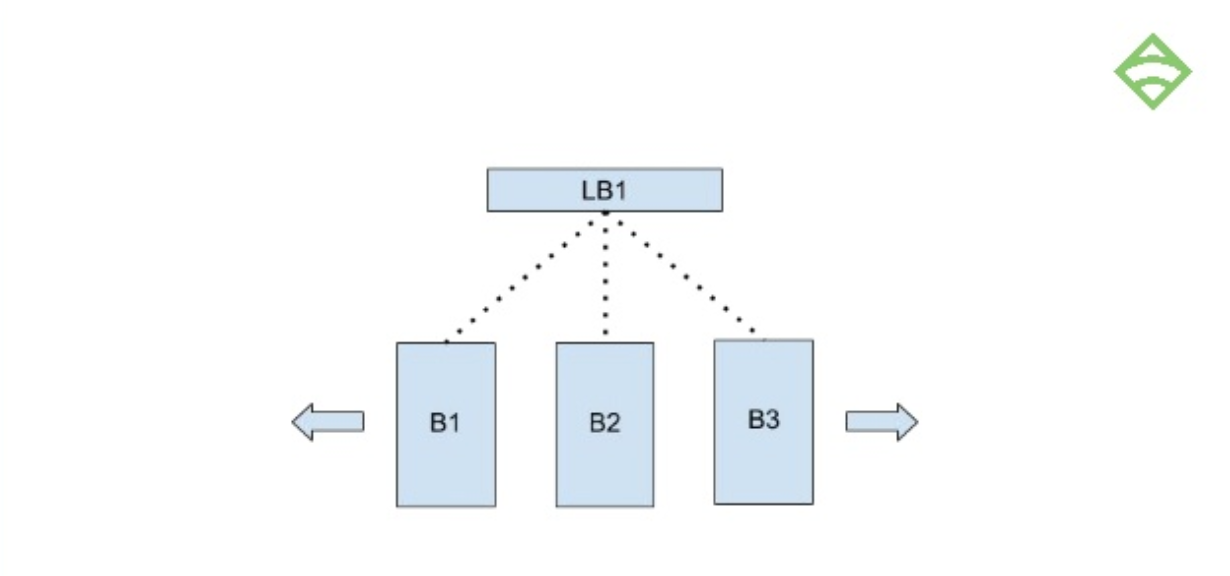
Adding extra load balancers will give you a highly redundant or highly available infrastructure.
Our hardware recommendations for a reasonable backend with embedded etcd (somewhere in the ballpark of 10K connected devices) includes the following:
- 16 vCPU
- 16GB memory
- Attached NVMe SSD
- Greater than 50MB/s and greater than 5K sustained random IOPS
- Gigabit ethernet (low latency)
Postgres requirements are similar, with two key differences: 1) significantly higher in write capability and 2) 10Gb ethernet. (As I mentioned earlier, we had to bond three 3Gb connections in order to get our results.)
Next steps
Sensu Go has made big strides since its release, with even more enhancements on the horizon, such as multi-site federation by the end of 2019, including:
- 40,000 agents per cluster
- Multiple/distributed Sensu Go clusters
- Centralized RBAC policy management
- Centralized visibility via the web UI
We’re thrilled to roll out these features and see how you use Sensu Go. Whereas it once was a monumental effort to manage 40,000 agents on 100+ clusters, à la the GoDaddy story, Sensu Go can now manage those agents on a single cluster! With so much improvement to the technology, you can get up and running quickly, and automate your monitoring workflows at enterprise-level scale.
Ready to try it out for yourself? Start using Sensu Go now.

Made with #monitoringlove by SensuTM in Canada 🇨🇦 and the USA 🇺🇸. © 2017-2021 – Privacy Statement – Terms & Conditions