This is a guest post from Marius Oehler of Novatec Consulting GmbH, an independent IT consultancy based in Germany. Marius is an expert on open-source observability and with his team supporting customers in the field of application performance management and monitoring for more than 15 years.
Monitoring systems is critical to any IT operation. For many companies, these systems are a critical business component that can have serious business impact (including expensive downtime) if these systems fail. For this reason, it is essential that you have a good monitoring system in place that you can rely on, one that notifies you early if unforeseen problems occur.
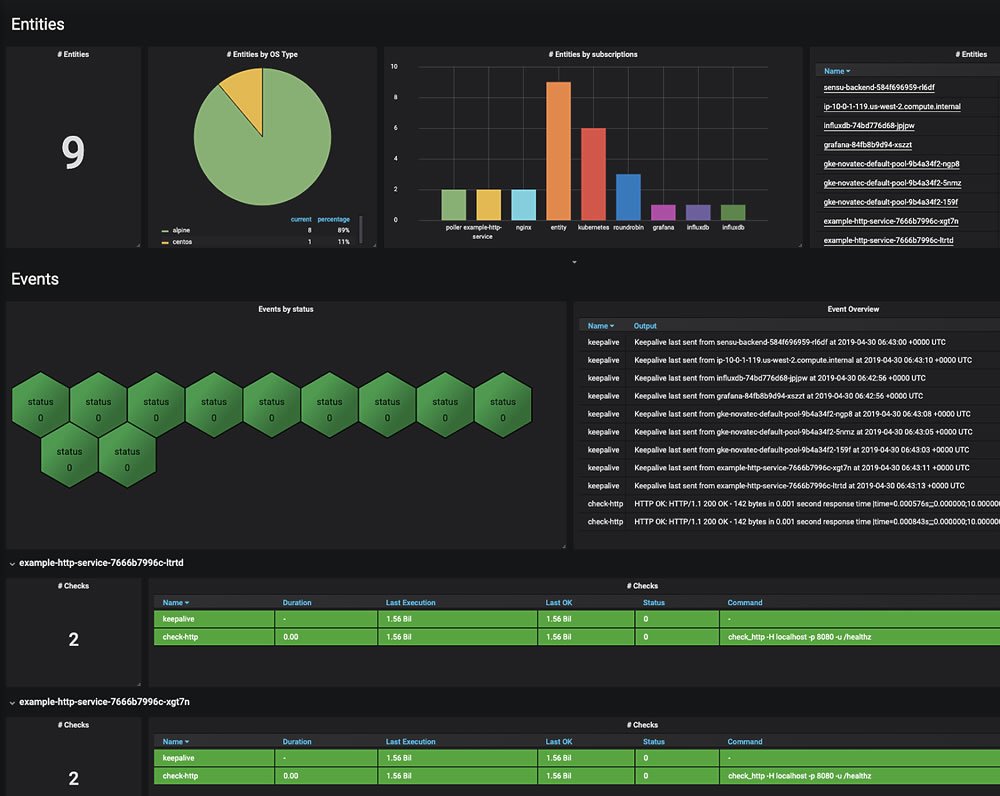 An example of Sensu Go data visualized in Grafana.
However, in many cases you’re not using a single tool to monitor your infrastructure, but a combination of several. Especially in the open-source space, it’s not uncommon to use one tool for monitoring, another for visualization, and yet another for metrics storage, as many systems have specialized in a certain area in which they are particularly good and versatile.
Despite the fact that several systems are used simultaneously, in many cases you want to have a central view or dashboard of your data and be able to correlate or compare it. For this purpose we recommend Grafana, as it’s the open-source tool for displaying data and creating dashboards and supports a variety of data sources.
For this reason we’ve developed, together with Sensu, the Sensu Go data source for Grafana, which allows us to display the data collected by Sensu Go together with a wide range of other data on a single Grafana dashboard. (If you haven’t downloaded the latest version of Sensu, you can do so here.)
In this post, we’ll give a short overview of how to set up and use the Sensu Go Grafana data source and what you can achieve with it.
Install the Sensu Go data source
Installing the data source is very easy and can be done using the CLI tool grafana-cli, (bundled with Grafana) which only requires a single command:
grafana-cli --pluginUrl https://github.com/sensu/grafana-sensu-go-datasource/releases/download/1.0.2/sensu-sensugo-datasource-1.0.2.zip plugins install sensu-sensugo-datasource
Alternatively, it can also be downloaded from its official GitHub repository and installed manually:
https://github.com/sensu/grafana-sensu-go-datasource
Please note that you have to restart your Grafana server to properly activate the newly installed plugin.
If you are using a managed Grafana instance, it depends on your provider whether they allow you to install additional plugins and how the installation process works.
Set up the data source
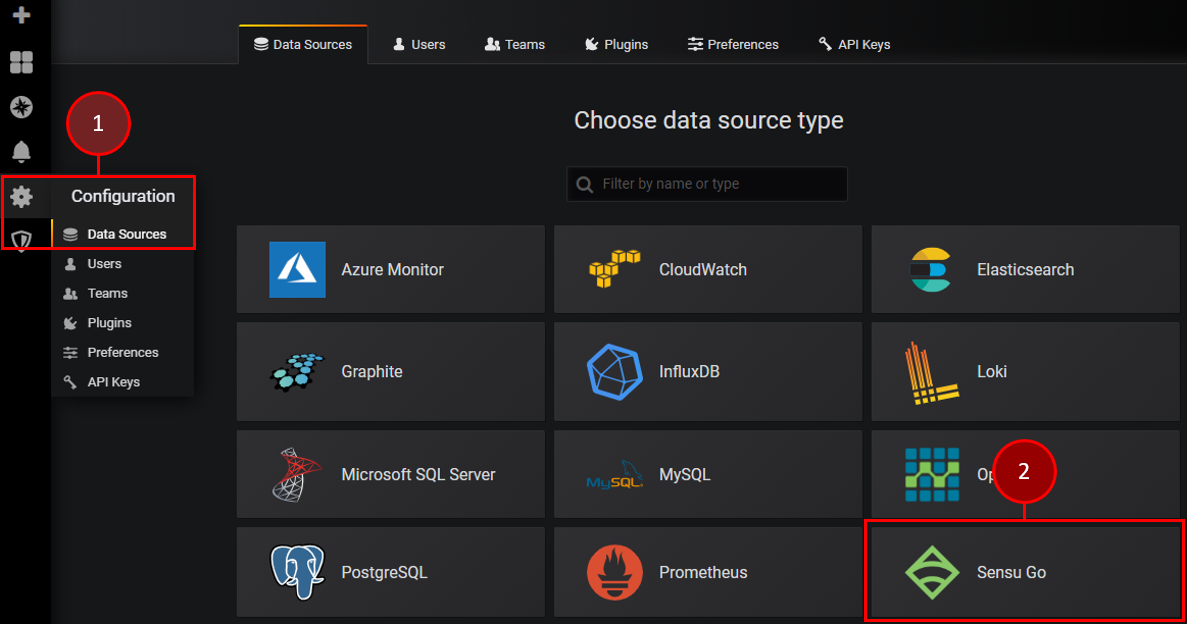
Once the Sensu Go data source plugin is installed, you can create and configure a new data source in Grafana. In order to do this, open Grafana and find the “Data Sources” link (1 in the following screenshot) in the side menu under the “Configuration” link. Click the “Add data source” button and select “Sensu Go” as data source type (2).
The configuration of the Sensu Go data source is quite simple and straightforward. All you have to do is give it a name and enter the correct Sensu Go API URL (where I’ve indicated “1” in the screenshot below). When connecting to a Sensu cluster, use any single backend in the cluster. For more information about configuring the Sensu API URL, see the Sensu docs.
Last but not least, the API credentials have to be provided (2 and 3 in the screenshot below). Please note that the API credentials must be entered via the fields of the “Basic Auth” section and the specified user requires get and list permissions for the entities, events, and namespaces API. For more information about creating a Sensu cluster role, see the Sensu docs.

Now, click the “Save & Test” button and — if everything is correct — you should see the following banner confirming that Grafana is connected to Sensu Go.

Using the Sensu Go data source
Now that you’ve set up the Sensu Go data source, you can use it as a data query in your panels to retrieve and display data from Sensu Go.
In the following example, I show how to list all systems using the entity API and display their hostname, operating system, and version. To do this, select the API you want to use (1) and the namespace you want to query (2). The data source supports different query types, but to simply query data the “Field Selection” query type has to be used (3).
By default, you will get all data provided by the specified API. In order to not fetch all available data, you can use the “Fields” section to precisely select individual fields you want to get to reduce the resulting data set (4).

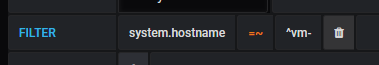
The result set can also be filtered to get only certain elements. For example, the following filter returns only entities whose hostname matches the specified regular expression of hostnames starting with “vm-”.
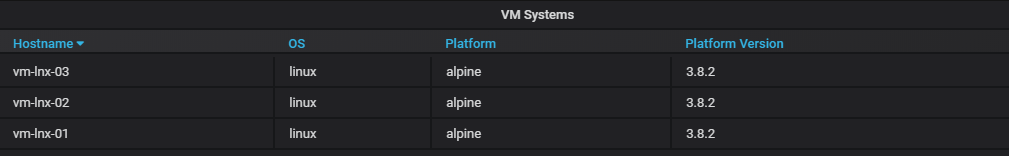
We now visualize the data in a table and get the following result:
Visualizing aggregated data from Sensu Go
In addition to retrieving data and displaying raw values, the Sensu Go data source can be used to display data in aggregated form. This can be helpful if, for example, you want to display the number of failing checks or connected agents.
In the following example, I use the events API (1) to retrieve existing checks and then count the number of unsuccessful checks. For this I set the query type to the value “Aggregation” (2) and create a filter, which only takes into account events whose “check.status” is not 0 — meaning they are not successful (3). Finally, I specify in the data source that I want to get the number of events (4) that apply to the above preferences.
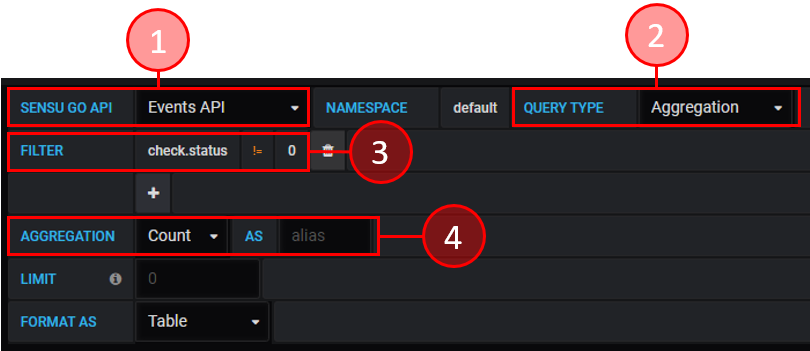
The result is visualized with the help of a so-called “Singlestat” panel, which is very well suited for displaying a single value. This allows you to see at a glance how many checks are currently failing in your system.

Using Sensu Go data as template variables
If you want to create dynamic dashboards in Grafana — for example, you have several environments and want to be able to select them and change them in the dashboard — you can use template variables by defining a query against a data source that is executed to obtain a set of values which can be used in the queries of a panel. This enables you to adjust filters dynamically, for example.
The Sensu Go data source also supports template variables and offers a SQL-like query language. While I won’t go in detail into its structure in this blog post, you can read about it in the GitHub repository. In the following examples, I’ll show you how to configure a dashboard to select or change the namespace if you have several (e.g.,one namespace for production and one for development) and want to switch back and forth between them.
To do this, you’ll use template variables. For this, go to the dashboard’s settings menu which you can find in the top navigation bar. In the settings view open the “Variables” section showing a list of existing variables and a “New” button to create a new variable.
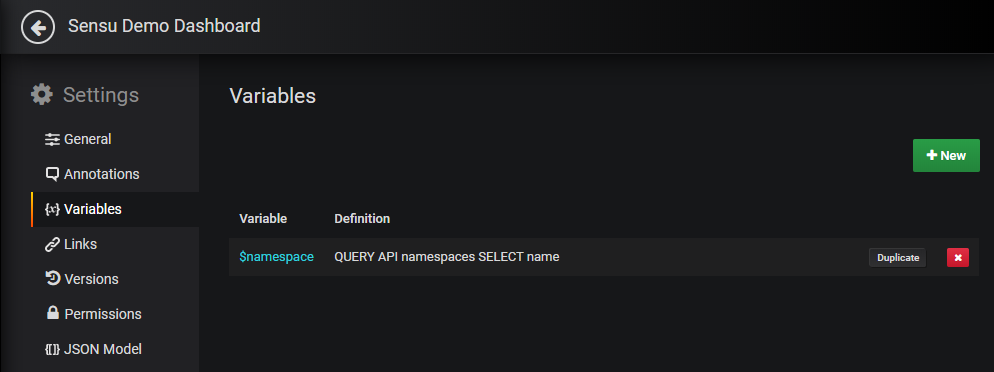
Click the “New” button and create a new variable of the type “query.” The specified name is the value that can be used in queries where the label contains a value displayed for the user (1). The “Data source” option specifies the data source we want to use for the query (2) and the “Refresh” option specifies how often the query is executed to update its values.
As already mentioned, you’ll use this variable to select the desired namespace and make the data of all panels on the dashboard refer to the selected namespace. You’ll specify a query with which you get the names of all existing namespaces to which the user has access (3).

To make the panels retrieve the data depending on the template variable created, you have to adjust the queries. In the “Namespace” field of the queries, you can now use the value “$namespace” to paste the variable’s value so the queries refer to the selected namespace.

Now you can simply select the desired namespace and display the desired data.

Another important and useful point, which we didn’t cover in this blog post, is you can also generate or repeat panels with the template variables. If you are interested in this, you can find more information in the Grafana documentation.
Going forward
Hopefully this blog post has given you a sense of how easy it is to display data from Sensu Go using the Sensu Go data source in Grafana — especially if you want to have multiple data sources at a glance. Thanks to the customizability and flexibility of Grafana and Sensu Go, you can create customized dashboards and retrieve exactly the data you need without losing focus on the essentials. There are hardly any limits and you have the possibility to build great dashboards based on existing plugins and panels.
Furthermore, you’ve also seen how to dynamically design dashboards using template variables to allow users to view data from different perspectives.
Because both of these technologies are open source, all the components required to replicate the above use cases are available free of charge — so nothing is stopping you from integrating your Sensu Go data into Grafana to build informative (and nice-looking!) dashboards.
Ready to get started? Download the latest version of Sensu Go today.
Related Posts

How to measure every API call in your Go app (in fewer than 30 lines of code)
In this blog post, Software Engineer Nikki Attea recaps her GrafanaCon 2019 talk, sharing how to measure every API call in your Go application (including visualizing StatsD data with Grafana!).

Making sense of time-series analysis
As the name suggests, a time-series is a representation of an event over a period of time. That could mean representing the highs and lows of your curling ice temperature over a year to your application usage data, such as error rates over time.

Made with #monitoringlove by SensuTM in Canada 🇨🇦 and the USA 🇺🇸. © 2017-2021 – Privacy Statement – Terms & Conditions