[Whitepaper] Integrations for cloud monitoring & alerting

In this whitepaper, you’ll learn about the various DevOps tools for monitoring with which Sensu integrates, as well as the data sources supported — all of which combined gives you a holistic approach to monitoring.

By: Team Sensu

Integrations for cloud monitoring & alerting

Sensu is a multi-cloud monitoring solution that enables you to integrate with a variety of data sources (everything from all the major cloud providers to containers and Kubernetes and even Nagios). Plus, you can also integrate with a variety of tools to handle that data — send alerts to Slack or PagerDuty; pipe data to a time-series database like InfluxDB, and so much more.

Sensu observability pipeline 
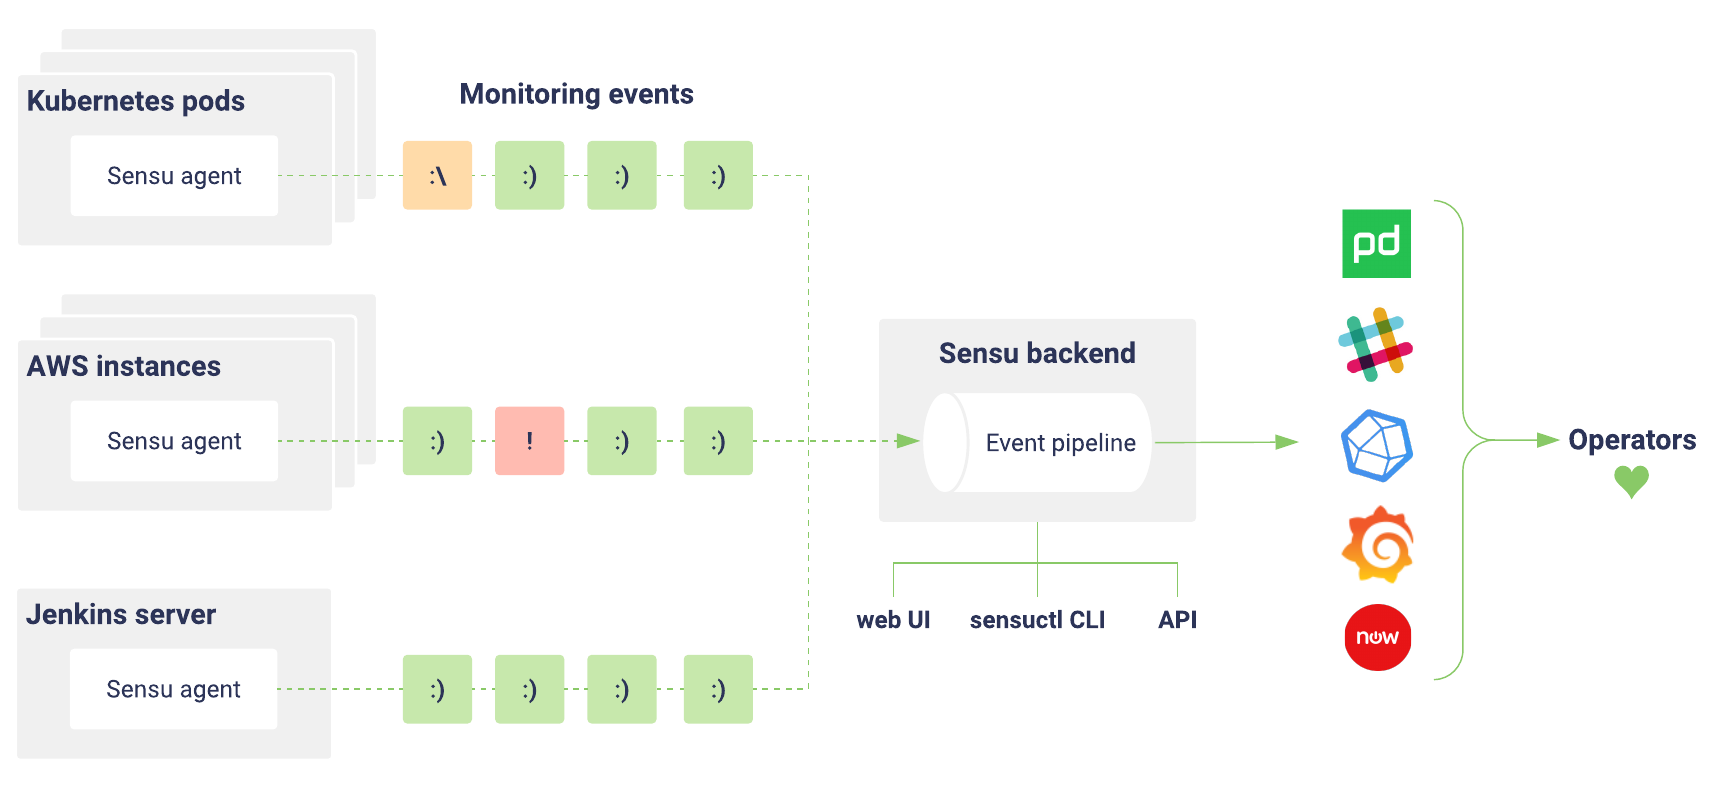
The Sensu observability pipeline lets you automate your monitoring workflows, empowering you to validate and correlate events, mutate data formats, send alerts, manage incidents, collect and store metrics, and more.

This guide offers an overview of the various DevOps tools for monitoring with which Sensu integrates, as well as the data sources supported — all of which combined gives you a holistic approach to monitoring.

Data sources

Businesses are migrating to the cloud to stay competitive, but that doesn’t necessarily mean one type of cloud (public or private) or that they’ve migrated entirely away from legacy technology. Maintaining visibility into your infrastructure is critical for business success, but that can become a challenge as new technologies are quickly adopted while legacy infrastructure remains very much in play. The solution? You need a future-proof approach to monitoring, one that lets you maintain visibility into your entire infrastructure, from Kubernetes to bare metal.

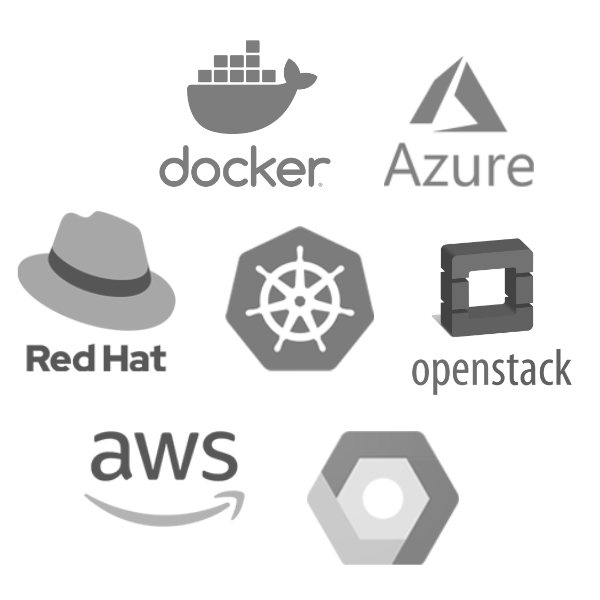
As a flexible monitoring event pipeline, Sensu lets you input data from virtually any source, enabling you to gain a complete picture of infrastructure health. Here are just a few of the cloud platforms where Sensu runs (and you can monitor with Sensu):

Integrations-cloud

  • Amazon web services (AWS), Amazon’s solution for on-demand cloud computing.
  • Google Cloud Project (GCP), Google’s suite of cloud computing services (also used by Google for its Search, Gmail, and YouTube products).
  • Microsoft Azure, Microsoft’s cloud computing service for building, testing, deploying, and managing applications.
  • Docker, a platform as a service (PaaS) that uses OS-level virtualization to deliver software via containers (isolated instances that bundle their own software, libraries, and config files).
  • Kubernetes, the open source container orchestration platform for automating deployment, scaling, and management of containerized infrastructure.
  • Red Hat OpenShift, containerization software built at Red Hat; the OpenShift Container Platform is an on-prem PaaS built around Docker and orchestrated by Kubernetes.
  • OpenStack, a free, open-standard cloud computing platform, deployed as IaaS in both public and private cloud environments.

Watch: Sensu Co-founder & CEO Caleb Hailey demos cloud monitoring with Sensu Go

In addition to plugging in data from various cloud platforms, you can also use Sensu to monitor the web platforms you’re already using. Here are just a few:

  • NGINX, a web server that can also be used as a reverse proxy, load balancer, mail proxy, and HTTP cache.
  • Apache, a free and open source web server.
  • Microsoft IIS, or Microsoft Internet Information Services, an extensible web server created by Microsoft for use with the Windows NT family.
  • Memcached, a general-purpose distributed memory-caching system, often used to speed up database-driven websites.
  • HA Proxy, a free and open source software that provides a high availability load balancer and proxy server for TCP and HTTP-based applications.
  • Apache Tomcat, an open source implementation of the Java Servlet, JavaServer Pages, Java Expression Language, and WebSock technologies.

Integrations logos monitoring

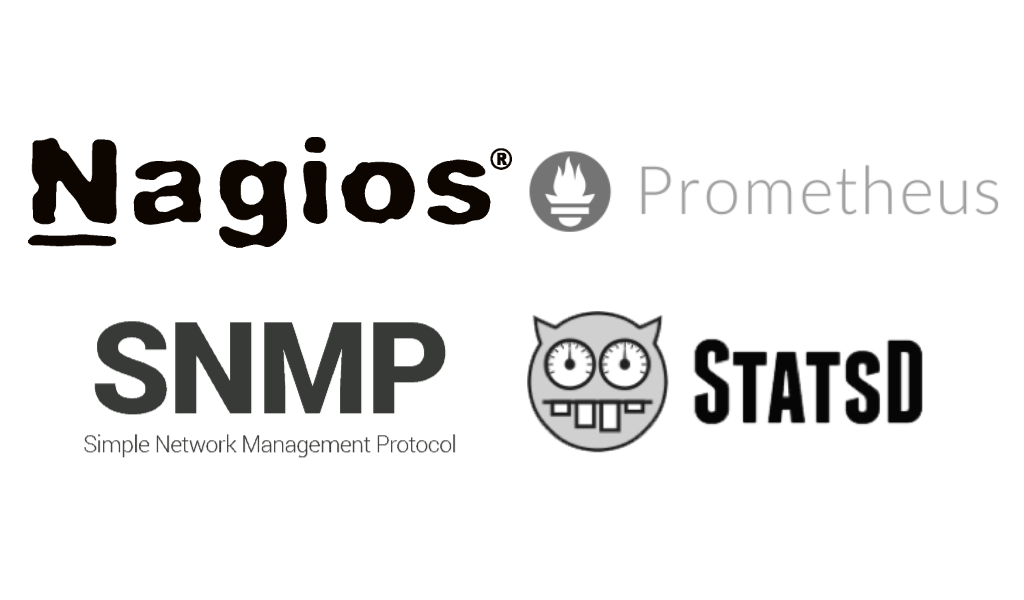
Sensu also integrates with the monitoring tools you’re already using, which (in cases like Nagios and SNMP) makes it easy for you to maintain visibility into legacy infrastructure without having to reinvent the wheel. Here are a few of the monitoring tools with which Sensu integrates:

  • Prometheus, the open source monitoring tool and CNCF project. Prometheus uses pull-based infrastructure, and is often the go-to for monitoring Kubernetes. Used in conjunction with Sensu, you can gain a complete picture for monitoring your entire infrastructure.

How to monitor Kubernetes with Sensu + Prometheus

  • Nagios, the open source monitoring tool for monitoring systems and networks. At Sensu, we believe the Nagios service check specification is underappreciated, which is why we made it support for Nagios service checks part of our very first commit.

Here’s the story of Nagios plugin support in Sensu

  • SNMP, or simple network management protocol, one of the oldest protocols used to manage a network. Send SNMP data to Sensu — using the sensu-plugins-snmp plugin to query SNMP devices you want to monitor.

How to simplify SNMP implementation with Sensu

  • StatsD, a tool for sending, collecting, and aggregating custom metrics. Using the Sensu StatsD listener, you can use StatsD to aggregate metrics, which Sensu then translates so they can be passed to the event pipeline (alongside all your other monitoring data).

Here’s how to aggregate metrics with the Sensu StatsD listener

Storing and visualizing monitoring data

You’re getting loads of telemetry and time-series data; now you need a way to securely store and analyze it. A database for metrics storage and time-series analysis will let you aggregate data and gain insights into system capacity, user behavior, services levels, security risks, and more. With Sensu, you can correlate and analyze monitoring data alongside other business metrics for improved business intelligence.

Grafana data source for Sensu Go

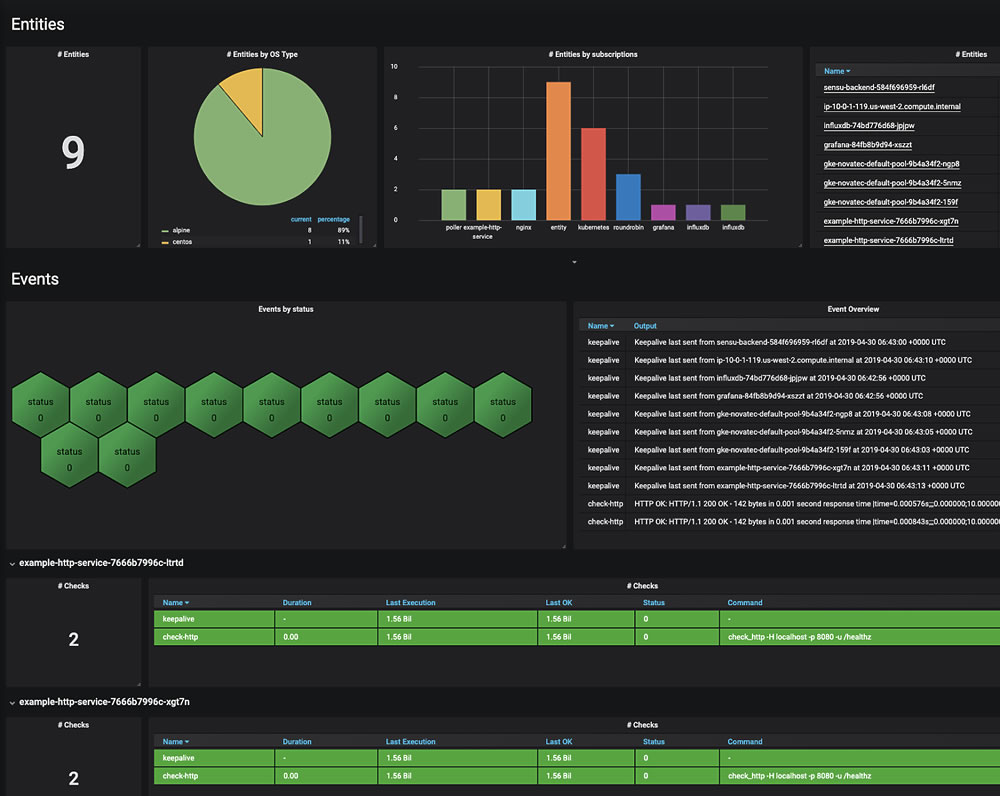
An example of Sensu Go data visualized in Grafana

Sensu integrates with the data platforms you’re already using (many of which you can both monitor and write data to), including:

  • InfluxDB, an open source time-series database developed by InfluxData. It is written in Go and optimized for fast, high-availability storage and retrieval of data for time-series analysis in fields such as operations monitoring, application metrics, Internet of Things sensor data, and real-time analytics.

Guide: Learn how to populate InfluxDB metrics

  • Elasticsearch, an open source search and analytics solution and the “e” in ELK stack. Elasticsearch provides a distributed, multi-tenant search engine built for the cloud. Built on Apache Lucene, Elasticsearch handles all types of data, including text-based, numerical, geospatial, as well as structured and unstructured data.

Check out the Elasticsearch plugin on Bonsai

  • Wavefront, VMware’s SaaS time-series database, designed to handle high ingestion and query loads. Wavefront offers a web-based GUI and various dashboards with which you can visualize your metrics. Sensu enables you to collect metrics and pass them through its pipeline, allowing Sensu to deliver normalized metrics to Wavefront.

Check out the Sensu Wavefront handler on Bonsai

  • Splunk, which uses a search engine database model to store and query data. By sending your monitoring data to Splunk, you can gain a holistic view of what’s going on in your infrastructure while operating at massive scale.

Learn more about Sensu event storage

  • Grafana, an open source analytics and visualization software. Programmed in Go (like Sensu!), Grafana can be used on top of a variety of data stores, including Graphite, InfluxDB, and Elasticsearch. Create beautiful — and informative! — Grafana dashboards by piping in your metrics and monitoring data from Sensu.

Learn more:

Check output extraction with InfluxDB and Grafana

Visualizing Sensu Go data with Grafana

In addition to the above-mentioned data platforms, you can write data to Postgres, MySQL, Redis, MongoDB, Cassandra, Kafka, and more.

Alerting and incident management tools

Alerting tools help you filter through the noise, helping you determine the severity level of an event, who to notify, and how to alert them. Your alerting and monitoring tool require a tight integration, so you’re not missing out on critical issues or being bombarded with needless alerts. Said another way, the right monitoring tool can help alert you to issues before your users do without causing alert fatigue. By integrating monitoring into your incident management platform, you’ll be able to act and respond quickly, making data-informed insights when it matters most.

Assets are the best way to make use of many of the integrations featured here. Starting in Sensu Go 5.13 and later, you can issue an easy command to add an asset:

sensuctl asset add NAME-OF-PLUGIN

Learn more about assets in our docs

Guide: How to use Sensu filters to reduce alert fatigue

With Sensu, you can send alerts to the platform of your choosing, including:

  • Slack, the popular chat app used by teams the world over. By sending alerts via the Sensu Slack app integration, you can stay up-to-date on what’s going on with your infrastructure within the same tool you’re already using for team collaboration.

Guide: How to send alerts to Slack

  • PagerDuty, the SaaS-based incident response platform. The Sensu + PagerDuty integration allows you to trigger and resolve PagerDuty incidents via Sensu, avoid false alerts by de-duping message, and map Sensu event severity to PagerDuty alert severity.

Interactive tutorial: How to send Sensu alerts to PagerDuty

  • JIRA, Atlassian’s issue tracking and project management product. The Sensu + JIRA integration lets you create, update, and resolve JIRA issues, so you can rest assured your monitoring data is being handled as it should.

Check out the Sensu JIRA handler on Bonsai

  • Email. With Sensu, you can send alerts to your email inbox so you can be notified as soon as an incident occurs. Pro-tip: apply filters in your email application, so you can easily sort and prioritize alerts.

Check out the Sensu email handler on Bonsai

  • ServiceNow, an IT operations management platform. The Sensu ServiceNow handler creates and updates ServiceNow incidents and events. If an item doesn’t already exist within ServiceNow, Sensu will create one automatically.

Check out the ServiceNow handler on Bonsai

  • VictorOps, incident management software for DevOps teams. VictorOps (now a part of Splunk) helps automate the delivery of alerts, making sure the right person is being alerted when they should. With the Sensu handler for VictorOps, you can send events directly to their incident response platform so you can benefit from a tightly integrated approach to monitoring and incident response.

Check out the Sensu handler for VictorOps on Bonsai

  • Opsgenie, the alerting and on-call management solution from Atlassian. With the Sensu Opsgenie handler, you can manage and trigger Opsgenie incidents for alerting the right people when needed.

Check out the Sensu Opsgenie handler on Bonsai

Configuration management and automation platforms

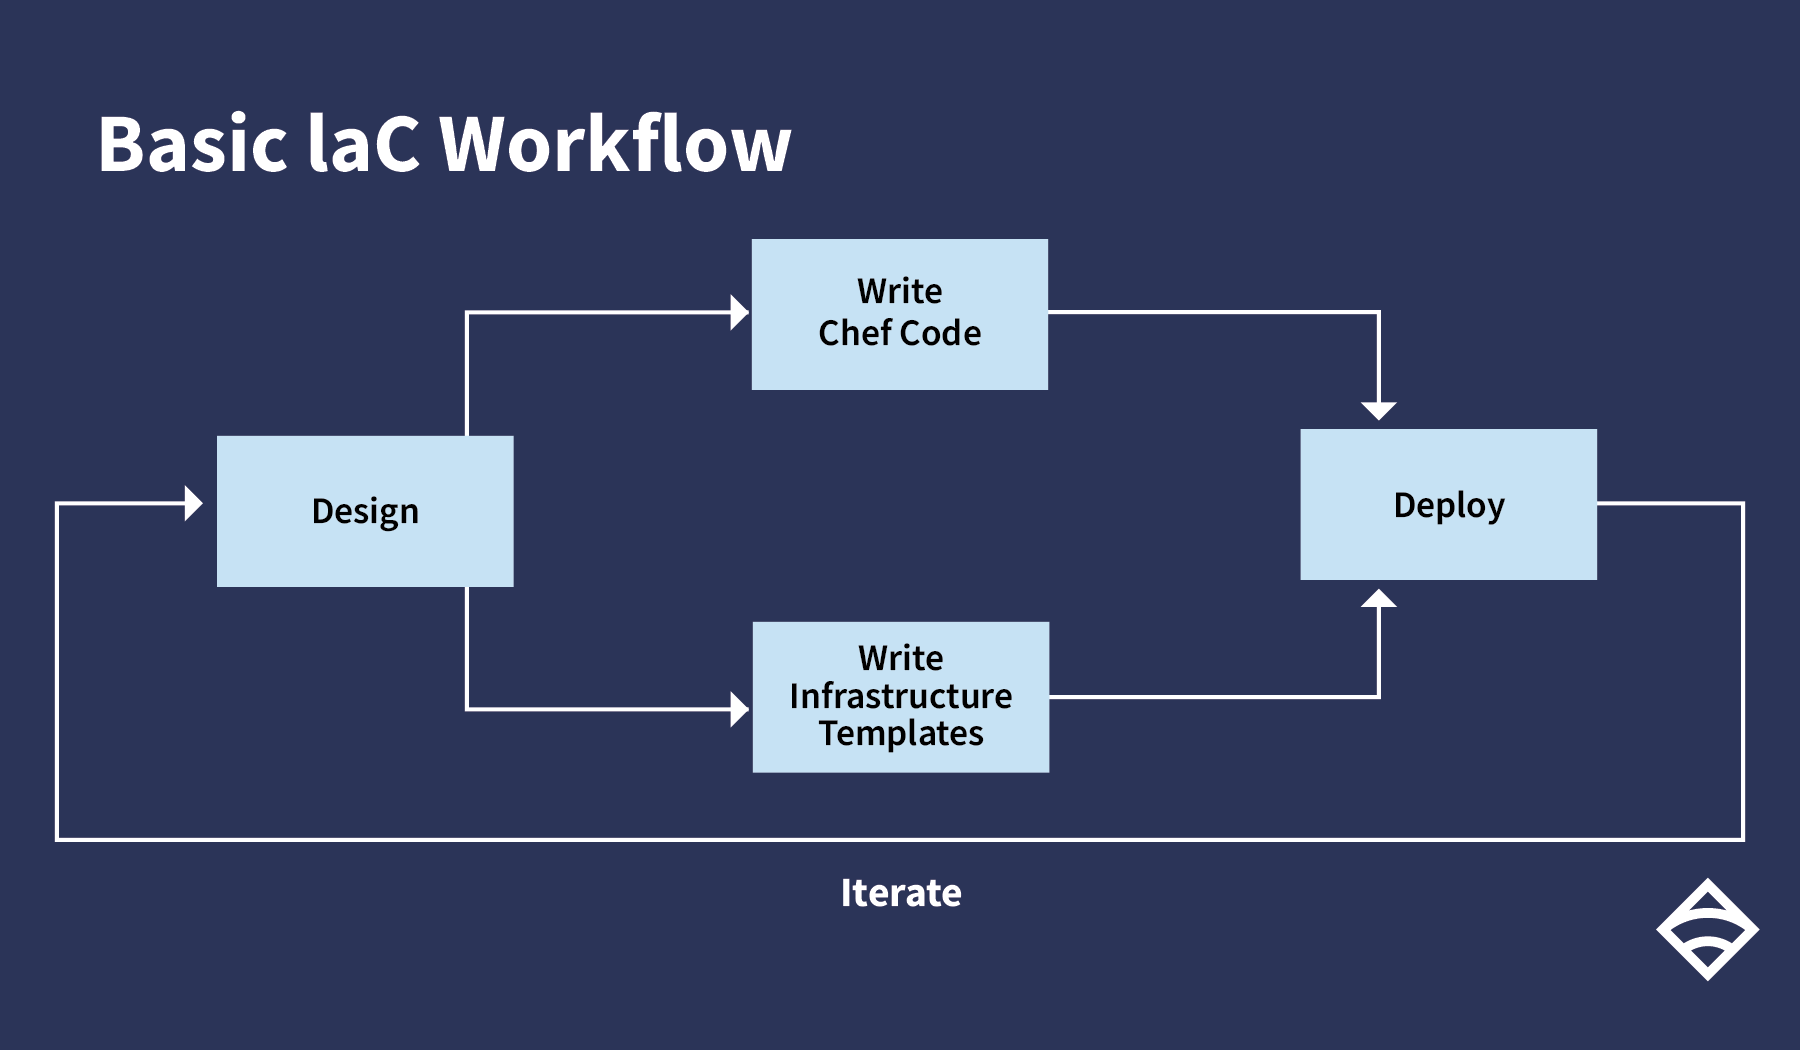
Configuration management tools enable you to automate a lot of work that used to be manual (and hence, error prone), ensuring your systems are configured consistently and correctly and helping you avoid the dreaded configuration drift. With the advent of infrastructure as code (IaC), operators are now applying software delivery best practices, like automated testing, version control, and continuous delivery, to their infrastructure and applications.

Learn more about the evolution of IaC

Configuration management tools enable you to apply IaC workflows to monitoring, too. By taking a top-level design and applying it to your monitoring strategy, you can ensure consistent configurations and overall increased efficiency.

Learn how to apply infrastructure as code to testing and monitoring

Integrations-logos-automation

Sensu integrates with your configuration management tool of choice, including:

  • Ansible, Red Hat’s open source configuration management tool. Ansible runs on Unix-like systems and can configure Unix as well as Microsoft Windows systems. Overall, Ansible makes it easy to automate your apps and IT infrastructure. With the Sensu Go Ansible Collection, you can easily configure your monitoring. Plus, Sensu integrates with Ansible Tower, the web-based interface for managing Ansible.

Learn more about the Sensu Go Ansible Collection

Watch the webinar on how to automate your monitoring with Sensu + Ansible

  • Puppet, a configuration management tool that relies on a declarative approach. Like many config management platforms, Puppet software helps you cut down on manual errors and treat your infrastructure as code. The most recent release of the Sensu module closely aligns Puppet module parameters with Sensu Go data types, thereby making operating Sensu an all-around more seamless experience.

Learn more about the Sensu Puppet module

  • Chef, a configuration management tool written in Ruby and Erlang. With Chef, you use prewritten code, known as “recipes,” to define your infrastructure, security policies, and system dependencies. Using a tool like Chef (or any configuration management tool, really), helps you maintain consistency and repeatability with your system — AKA, automating previously manual work so operators can focus on new projects.

basic IaC workflow with Chef

Learn more about using Chef for infrastructure management

You can also automate your Sensu monitoring with Terraform, HashiCorp’s open source IaC software tool; Helm, the Kubernetes package manager; and Pulumi, the open source IaC SDK.

Over to you

Thanks for taking the time to review (just a few) of the available monitoring integrations for Sensu! Check out related resources below, and join our community on Discourse.