Your registration has been confirmed. Thank you for signing up!
In this whitepaper, we’ll offer a bit of background on Kubernetes, including some of the challenges when it comes to monitoring Kubernetes. We’ll also go over current best practices for monitoring and observability in a cloud-native world, including the sidecar pattern for monitoring Kubernetes.
Kubernetes is an open source container orchestration system. Originally launched as a Google project in 2014, Kubernetes is now maintained by the Cloud Native Computing Foundation (CNCF).
Container orchestration, at its most basic, makes it easier for you to deploy, scale, and manage your container-based infrastructure. Containers are increasingly becoming the norm in modern cloud environments, but the ease and flexibility with which they enable you to spin up new instances comes at a cost — namely, complexity. With so many moving pieces, it’s all the more critical to be able to schedule and provision your containers while maintaining a desired state — automatically. That’s where Kubernetes comes in. What’s more, Kubernetes can deploy your applications wherever they run, whether that’s a cloud platform like AWS, GCP, or Azure, or even bare metal servers.
Kubernetes lets you manage an entire fleet of containers, across their entire lifecycle, giving you the ability to automate the deployment and scaling of several containers at once. If you have your application running across several containers, you can group those together. These Kubernetes containers are replicas, helping you balance load across the various instances. Say, for example, you had your site on two containers, orchestrated by Kubernetes — you could balance traffic to your site easily between the two containers, and Kubernetes would make sure everything is in the state it should be.
Kubernetes consists of many components, but arguably one of the most important is the control plane, which governs how Kubernetes interacts with your cluster.
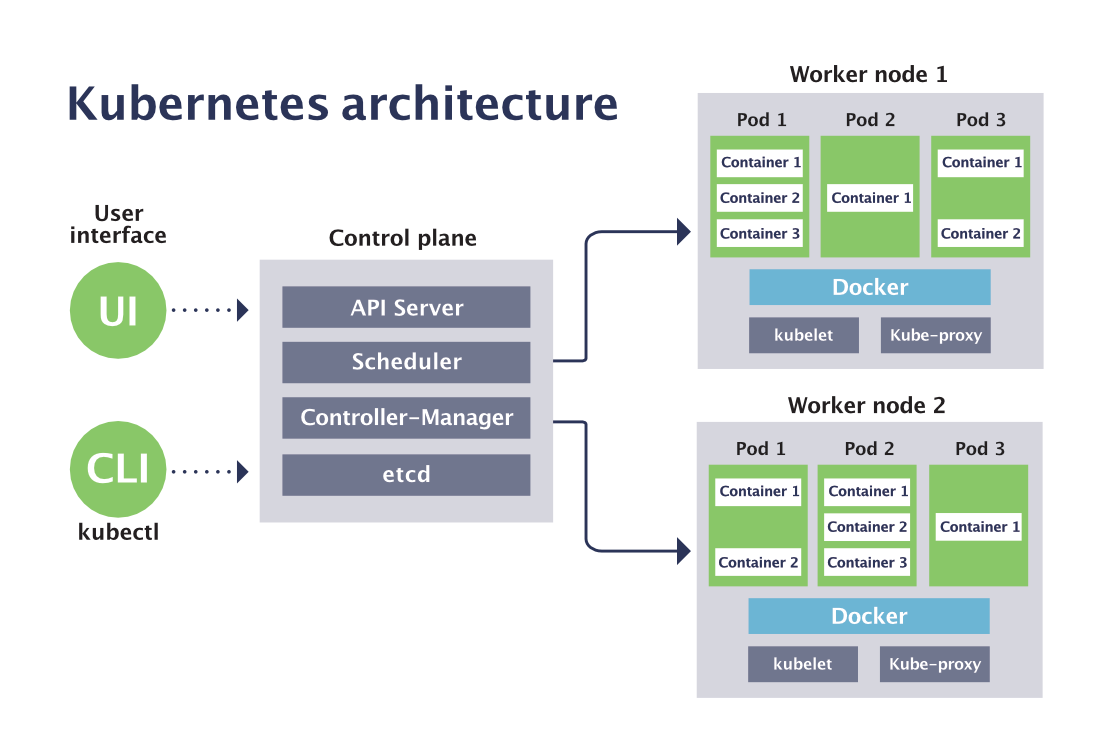
Kubernetes and Docker are not mutually exclusive; in fact, they’re quite complementary! Docker is a Platform as a Service (PaaS) solution that lets you install and run containerized applications. Kubernetes is the orchestration platform for containers; if you’re using Docker to containerize your applications, then more likely than not you’re using Kubernetes for orchestration. Put another way, Docker gives you the ability to containerize applications, while Kubernetes empowers you to orchestrate and manage those containers, at scale.
For a deeper dive into the inner workings of Kubernetes, plus terms and definitions, check out these resources:
The flexibility and power that comes with containerized infrastructure also carries inherent challenges when it comes to observability. You’ll need to keep an eye on things like how many resources you have available in a certain deployment, as well as overall infrastructure and application health (not to mention the health of those applications running on your Kubernetes infrastructure).
Here are (just a few) of the challenges when it comes to monitoring Kubernetes:
Sensu CTO and co-founder Sean Porter outlines the data sources for monitoring Kubernetes in detail in this post. In short, you need to be able to collect data from four main sources:
Broadly speaking, here are a few strategies for monitoring Kubernetes:
Prometheus is an open source monitoring tool and also a member of the CNCF. It’s often the go-to choice for monitoring Kubernetes due to its built-in exporters, and is a great solution if all you need to monitor is Kubernetes.
CTO Sean Porter writes about the ways that Prometheus can be a great telemetry-based monitoring companion to Kubernetes. In particular, if you don’t want your developers to have to think about modifying their deployment YAML, Prometheus is great. You can instrument your apps and expose telemetry-focused metrics and you’re done. And, you could always have developers reference a ConfigMap to make use of a sidecar pattern (more details on that below).
Other benefits of Prometheus for monitoring Kubernetes include:
Although we’ve listed Prometheus’ data collection model defaulting to time series as a benefit, it also presents a downside: while it simplifies things by making it easy to standardize collecting data, it’s also limiting, presenting a constrained data model that might be missing some context.
Additional cons include:
For comprehensive observability — especially when dealing with multi-generational infrastructure — we recommend a hybrid approach. If you plan on using Prometheus to monitor Kubernetes and you’re also dealing with other platforms, like cloud and bare metal, pair it with a complementary solution like Sensu, which gives you additional context from events, health checks (i.e., more than metrics), and the ability to process observability data as a workflow, all while offering a secure solution.
Here’s how to monitor Kubernetes with Sensu + Prometheus
In the next section, we’ll take a look at the sidecar pattern for monitoring Kubernetes.
The sidecar pattern for monitoring Kubernetes is a more dynamic approach. In fact, sidecars as a pattern aren’t a formal convention of Kubernetes, but they’ve picked up speed as the Kubernetes community experiments and figure out what works.
Examples of Kubernetes sidecars include:
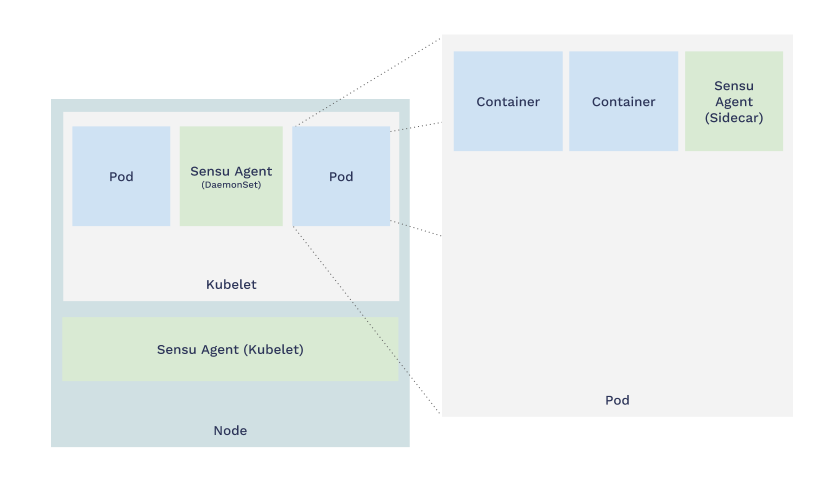
When you use the sidecar pattern, your Kubernetes pod holds the container that runs your app alongside the container that runs the Sensu agent. These containers share the same network space so your applications can talk to Sensu as if they were running in the same container or host.
The benefits of sidecars align with the very same values that give microservices an advantage in a cloud-native context. Sidecars are:
Check out this post for more info on Kubernetes monitoring using the sidecar pattern.
In this tutorial, we’ll deploy an example application (a default NGINX website) in Kubernetes using kubectl to manage the deployment. In the second part of the demo, we’ll look at how to monitor the application we’ve deployed.
If you want to follow along at home, you’ll need to install Kubernetes (or set up the Minikube tool to run Kubernetes locally) and deploy Sensu into Kubernetes. As a companion to Sensu, we’ve included InfluxDB as a time-series database and Grafana for building custom visualization dashboards.
First, deploy your NGINX deployment using kubectl apply:
$ kubectl create namespace webinar
$ kubectl --namespace webinar apply -f kubernetes/nginx-deployment.yaml
$ kubectl --namespace webinar get services
NAME    TYPE           CLUSTER-IP      EXTERNAL-IP     PORT(S)          AGE
nginx   LoadBalancer   10.27.251.183   35.230.122.31   8000:30161/TCP   33d
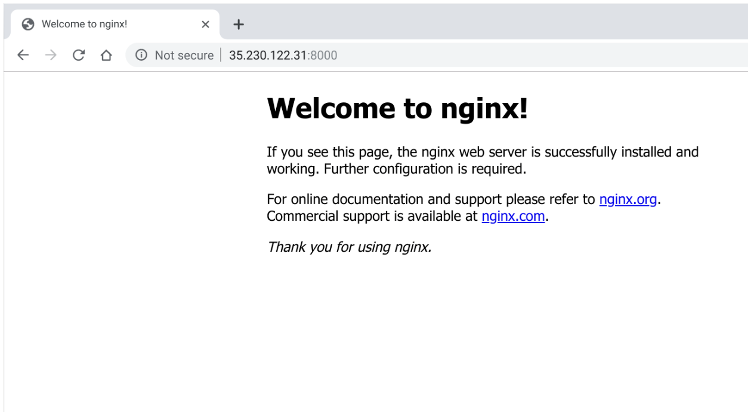
The NGINX container by default runs on port 80. Here we expose that outside of the Kubernetes cluster at port 8000.
Now, visit your example application in your browser, accessible at http://35.230.122.31:8000 And, voilà! We’ve launched a new service, all powered by Kubernetes.
This is the stage that a lot of you may have reached: You’ve deployed an app or service in Kubernetes, but want to figure out the best way to monitor it.
Let’s look at how to add the Sensu Go agent as a sidecar to your application. (This works with all Kubernetes controllers: deployments, Statefulsets, DaemonSets, and so on.)
Update your deployment using kubectl apply:
$ kubectl --namespace webinar apply -f kubernetes/nginx-deployment-with-sensu-sidecar.yaml
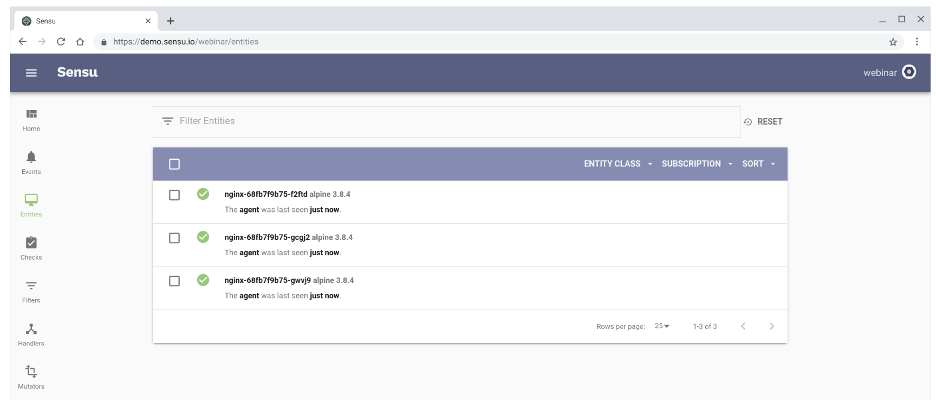
Visit the Sensu dashboard, and you’ll see Sensu auto-register the sidecars. (Sensu also automatically de-registers nodes, so you can tell the difference between a node that’s down versus one that’s been de-provisioned.)
Here’s the excerpt from the .spec.template.spec.containers scope in the Kubernetes deployment that makes this possible:
- name: sensu-agent
  image: sensu/sensu:5.11.1
  command: ["/opt/sensu/bin/sensu-agent", "start", "--log-level=debug", "--insecure-skip-tls-verify", "--keepalive-interval=5", "--keepalive-timeout=10"]
  env:
  - name: SENSU_BACKEND_URL
    value: wss://sensu-backend-0.sensu.sensu-system.svc.cluster.local:8081 wss://sensu-backend-1.sensu.sensu-system.svc.cluster.local:8081 wss://sensu-backend-2.sensu.sensu-system.svc.cluster.local:8081
  - name: SENSU_NAMESPACE
    value: webinar
  - name: SENSU_SUBSCRIPTIONS
    value: linux kubernetes nginx
  - name: SENSU_DEREGISTER
    value: "true"
  - name: SENSU_STATSD_EVENT_HANDLERS
    value: statsd
Now that you have this configuration in place, you can scale resources easily.
kubectl --namespace webinar scale deployment nginx --replicas 10
Before we configure the monitoring check, here’s some background on Sensu’s architecture and how the services communicate. The Sensu agent communicates with the Sensu backend in a pub-sub model, and the agent only requires outbound network access so we don’t have to open ports in the agent or on the pod to get access to them. Agents have TLS-encrypted web sockets in Sensu Go, and they maintain this connection with the Sensu backend, with built-in support for high availability.
When the agent connects, it self-describes its role. In the case of a sidecar, it says, “I’m on Kubernetes, I’m a Docker container, and my role is an NGINX service.” The agents subscribe to topics, called subscriptions, on the backend in order to gather data. Sensu supports a wide variety of plugins, from Nagios plugins to your localhost StatsD socket to Prometheus endpoints and more.
In this tutorial, we’ll configure a simple check with the Nagios check_http plugin.
First, you need to provide the Sensu configuration, which includes four main attributes: resource type, API version, metadata, and spec. These get registered in the control plane and associate with the monitoring check configuration.
For example, here’s a monitoring check in Sensu with the plugins needed to register that check:
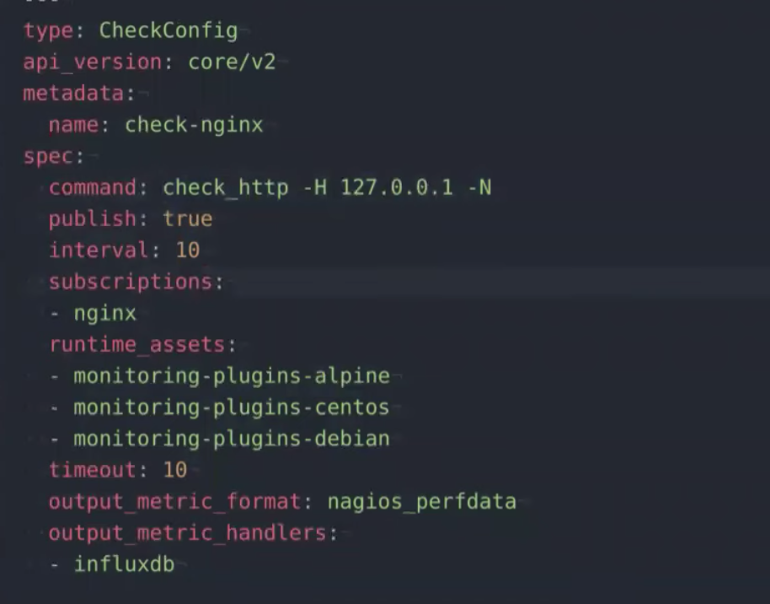 The output is in the format of
 nagios_perfdata, and we want it to write to InfluxDB.
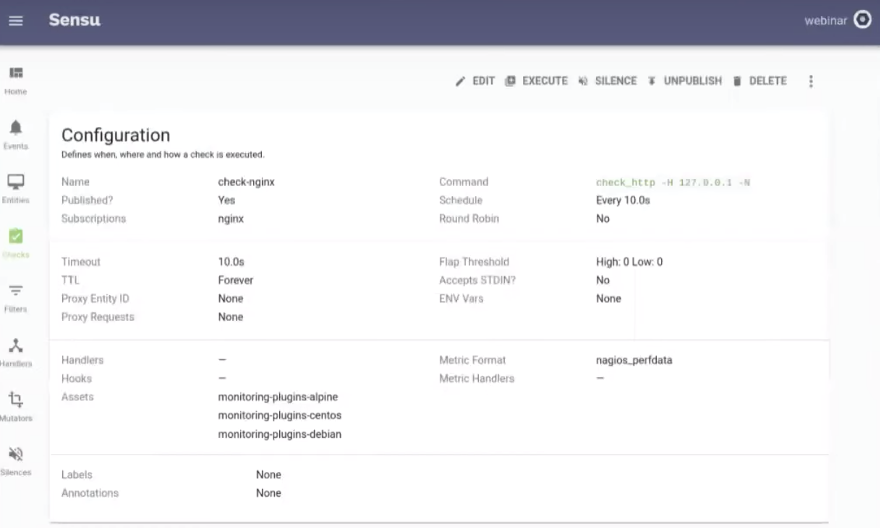
Let’s configure the monitoring check:
$ sensuctl --namespace webinar create -f sensu/checks/check-nginx.yaml
You’ll see the configuration appear in your Sensu dashboard, where it can be edited if needed, and it’ll automatically execute on all three of your Kubernetes pods.
 Here’s your service check result:
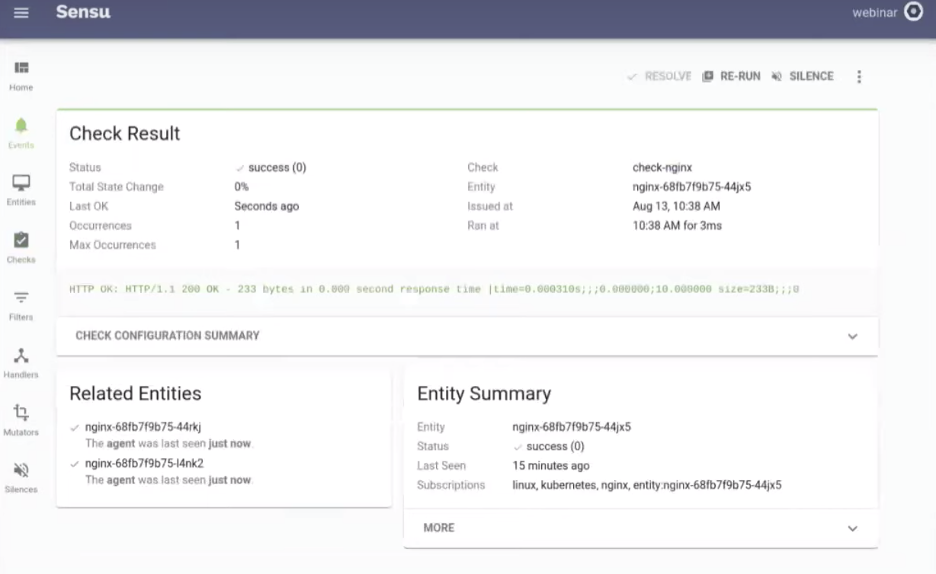
Eventually, we want a dashboard of this data, and that’s where Sensu’s observability pipeline makes a big impact. You can configure an InfluxDB handler in Sensu that converts the data from its Nagios format to InfluxDB format, so it can be written into InfluxDB and you can start seeing the metrics on your Granfana dashboard.
Here’s how to configure the telemetry pipeline (InfluxDB handler):
$ sensuctl --namespace webinar create -f sensu/handlers/influxdb.yaml
You can revisit these configurations in GitHub.
There you have it! Now you’ve got a simple pipeline set up that collects metrics from Kubernetes via a sidecar pattern and is able to send the data to Grafana for visualization.
We hope this guide gave you a sense of how to start monitoring Kubernetes using the sidecar pattern. Check out additional resources below, and join us on Discourse to learn from the Sensu Community.
Kubernetes is an open source container orchestration platform. Because containers are easy to spin up and down (and you can have any number of containers running at a given time), it’s important to have a way to keep track of their state. Kubernetes makes it a lot easier to manage containers; it will automatically schedule and provision them, all while keeping them in a desired state.
Kubernetes is used for operating a fleet of containerized applications, taking care of restarting containers and spinning up new instances as needed. All this is done automatically, making it easier for you to deploy and manage containerized applications at scale.
The Kubernetes cluster includes the following components, put together in a single unit: the Kubernetes pod, which is a group of containers; deployments, which define the scale at which you want to run your applications; a service, which defines a logical set of pods and a policy for accessing them; nodes, which manage and run pods; and the Kubernetes control plane, which is the main point of entry for managing the various nodes.
To install Kubernetes in a test environment, use Minikube, which offers a great tutorial for getting started. When you’re ready to install Kubernetes in production, you’ll use kubectl, the Kubernetes command-line tool, to deploy your applications.

Made with #monitoringlove by SensuTM in Canada 🇨🇦 and the USA 🇺🇸. © 2017-2021 – Privacy Statement – Terms & Conditions