Your registration has been confirmed. Thank you for signing up!
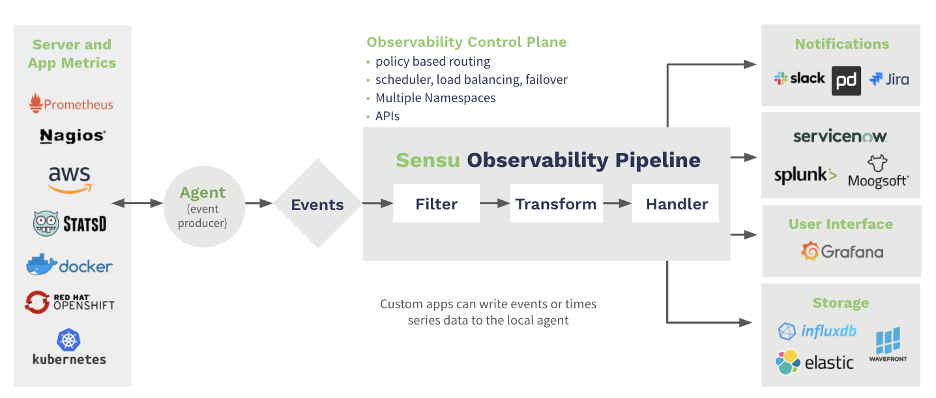
With the Sensu Observability Pipeline, you can consolidate monitoring tools to fill gaps in observability, eliminating data silos and automating diagnosis and self-healing — from bare metal to Kubernetes.
In this guide, we’ll cover some of Sensu’s unique features as compared to others in the industry.
Sensu is an Observability Platform that delivers Monitoring-as-Code for any Cloud environment. Sensu empowers DevOps and SRE teams to automate monitoring workflows, integrate best-of-breed tools, and achieve instant visibility into cloud native, ephemeral infrastructure. It is designed for enterprises transitioning from legacy IT infrastructure to ephemeral cloud and container-based environments. It allows enterprises to preserve business continuity while offering a flexible, API-rich observability pipeline for DevOps.
In this guide, we’ll cover some of Sensu’s unique features as compared to others in the industry.

Sensu solves challenges inherent to the elastic nature of cloud computing by automatically registering and deregistering new endpoints, including compute instances and containers. Sensu makes it easy to monitor dynamic infrastructure and reduce OpEx resulting from responses to false positive alerts triggered by workloads reaching the end of their lifecycle and being decommissioned (i.e. common cloud provisioning events). Sensu decouples “hosts” from monitoring configuration, eliminating the need to manage host and hostgroup configuration objects – a task that many have found to be challenging if not impossible to automate using traditional monitoring tools like Nagios, Zabbix, OpsView, and Icinga in today’s world of ephemeral cloud computing.
Host-based approaches to monitoring configuration and tightly-coupled configuration objects worked well with the primarily static infrastructures of the late 90’s and early 2000’s, but this same methodology has proven extremely fragile in the cloud era. Sensu eliminates risks related to traditional host-based monitoring configuration management by adopting a service-based declarative configuration model and configuration API. Sensu empowers DevOps and SRE teams to automate monitoring configuration changes and treat monitoring as code.
Sensu is a compelling alternative to Nagios, Zabbix, OpsView, and Icinga because it makes it easy to migrate your existing service checks. Sensu checks offer built-in support for monitoring “commands,” and 100% compatibility with Nagios-style plugins. Sensu enables organizations to breathe new life into their existing monitoring instrumentation to unblock cloud adoption or other digital transformation initiatives.
Sensu is widely used in large F-500 enterprises looking for a solution to monitor their legacy infrastructure as well as multi-cloud environments. With Sensu you can reuse battle-tested data sources (Nagios, Zabbix, OpsView, and Icinga plugins) in these modern contexts, while supporting newer data sources such as Prometheus in a unified platform.
The adoption of public cloud and containers in the enterprise requires a shift in the tools used for IT management. Migrating workloads to container-based environments like Kubernetes requires relatively simple changes in application delivery, but these same changes are often incompatible with traditional monitoring tools. Sensu enables organizations to avoid costly delays in cloud migrations and other digital transformation initiatives with innovative solutions like on-demand distribution of traditional monitoring plugins in cloud-native environments.
Adopting DevOps and SRE practices has created tremendous demand for “as code” solutions. Elastic IT environments managed as infrastructure code and deployed as immutable compute instances or containers can be dynamically provisioned in a manner that outpaces host-based monitoring tools. By the time configuration management updates a hostgroup and restarts or reloads the monitoring service, the new endpoints may have already been deprovisioned.
Sensu provides the functionality and automation that are essential for such dynamic environments ranging from completely automated deployment based on monitoring code templates (YAML configuration files), to flexible APIs to control all elements of the monitoring platform. It allows scaling your monitoring with your infrastructure without the burden of manual provisioning which is always out of sync with the state of the infrastructure.
Sensu allows integrating best-of-breed observability solutions such as Elastic, Splunk, Influx, Wavefront, Prometheus, Grafana by providing a single Observability Pipeline across all departments and tools. More importantly, it fills the gaps that exist in these best-of-breed products either by providing the missing features itself or by integrating with complementary products.
Sensu has native handling of protocols such as Prometheus, StatsD, and Nagios plugins and integrates with operational tools such as PagerDuty, ServiceNow, Rundeck, Moogsoft, and many more.
The same advantages that make Sensu a compelling alternative to traditional monitoring tools like Nagios, Zabbix, OpsView, and Icinga for modern cloud infrastructure also apply to use cases like IoT monitoring. Sensu’s lightweight agents, minimal configuration requirements, and push architecture has been used for custom solutions to monitor the IoT platforms and connected devices. Sensu integrates with IoT gateways to route telemetry and device health data to Sensu backends. The extensible data format even allows transmitting “custom” discovery or other data from the sensors to any desired backend. Dynamic runtime assets allow for updating checks on the fly after initial deployment without any external configuration management.
Sensu’s monitoring agent and publish/subscribe architecture eliminates the need to open firewall ports for centralized polling. Sensu agents can connect to the Sensu platform via mTLS authentication over a TLS encrypted transport, with support for integrating with existing certificate infrastructure (PKI/CRL systems). Integrate with third-party tools and services confidently thanks to Sensu’s built-in Secrets Management solution and HashiCorp Vault provider. Manage access to the Sensu observability platform with SSO providers (LDAP, Active Directory, OIDC), and built-in role-based access controls (RBAC).
Monitor tens of thousands of nodes from a single cluster using Sensu’s high-performance enterprise datastore. Get visibility into globally distributed infrastructure with Sensu federation.
Comprehensive system and service health monitoring. Execute custom scripts, including Nagios-style plugins. Collect basic system metrics, including CPU, memory, and disk usage. Collect custom application metrics and integrate with external databases for unified business intelligence. Collect logs and send them to the database of your choosing.
Send alerts via email, Slack, SMS, and more. Create and resolve incidents in PagerDuty, ServiceNow, and JIRA. Eliminate alert fatigue with built-in de-duplication. Customize alert policies with event filters and contact routing.
Auto-scale with confidence and real-time visibility. Sensu agents automatically discover and register VMs, public cloud compute instances, containers, and the services running on them. Plus, you won't get alerts for stuff that no longer exists.
Native support for self-healing — use Sensu to trigger service restarts or execute custom scripts when problems are detected. Request Ansible jobs via the Ansible Tower integration. Trigger remediation actions via third-party APIs. Automate repetitive operations by configuring custom workflows.
Not only are there monitoring plugins and integrations for every use case, but pre-configured templates offer all the flexibility of monitoring-as-code workflows with no coding required. Our turn-key integrations are backed by declarative configuration templates that can easily be edited, reviewed, version-controlled, and shared amongst teams.
As infrastructure complexity increases, it’s more critical than ever to have a centralized management interface for monitoring. Just as Kubernetes serves as a control plane for container orchestration, so too should your monitoring be able to manage highly complex observability workflows in an automated and repeatable fashion.
Ready to learn more? Check out the following resources:


Made with #monitoringlove by SensuTM in Canada 🇨🇦 and the USA 🇺🇸. © 2017-2021 – Privacy Statement – Terms & Conditions